Thursday, October 1, 2015

Filters at Dataset Level in SSRS 2014


In SQL Server Reporting Services, Filters are similar to SQL WHERE Clause. Filters is used to restrict the Records displayed by the SSRS Reports. SSRS supports two types of Filters: Filters at Tablix Level and Filters at Dataset Level.
In this article we will show you, How to filter the data at Dataset Level in SQL Server Reporting Services 2014 with example.
TIP: If you want to apply the filters on multiple reports then, you can apply filters at shared dataset. It will be applicable to all the tables using that Dataset.
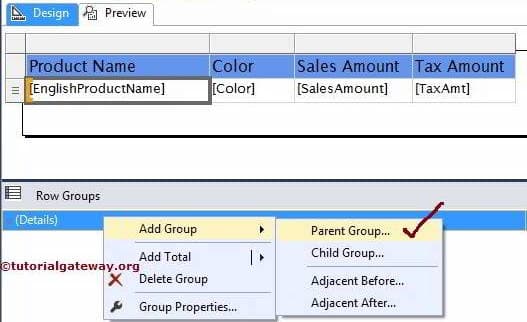
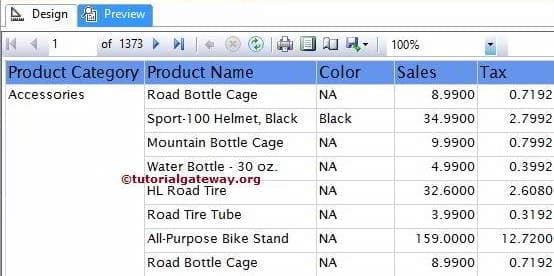
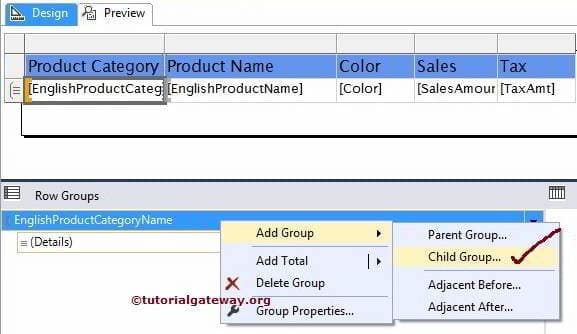
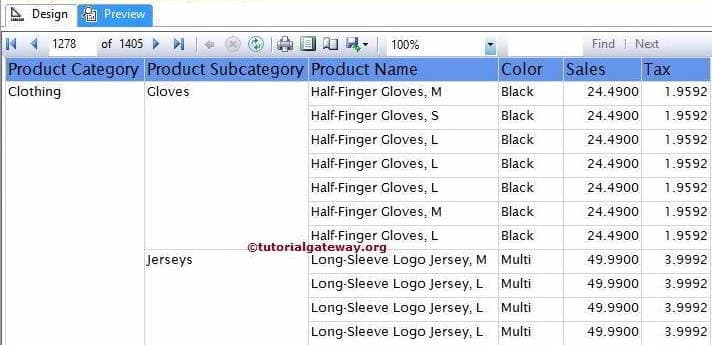
We are going to use below shown report to explain, filtering the data at Dataset level. Please refer SSRS Table Report article to understand the Data Source and Dataset we used for this report. If you observe the below screenshot, It was a normal report with Product Name, Color, Sales Amount and Tax Amount columns.
Filtering data at Dataset Level in SSRS 2014
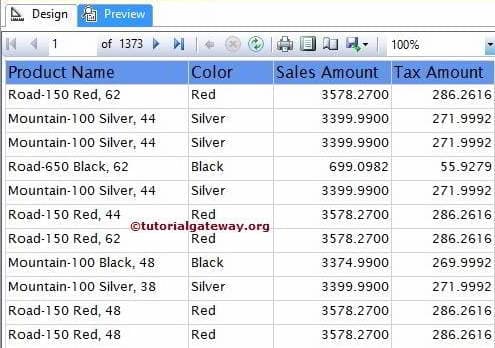
If you observe the above screenshot, it is displaying the 1373 pages of data.

Filtering data at Dataset Level in SSRS 2014

Select the Dataset from the Report data tab of the report and Right click on it will open the context menu. Please select the Dataset Properties.. option from it
Filtering data at Dataset Level in SSRS 2014 1
Once we click on the Dataset Properties.. option, a new Dataset Properties window will be opened. Please select the Filters tab as shown in below screenshot.
Filtering data at Dataset Level in SSRS 2014 2
Click on the Add button will display the below properties
  • Expression: It will allow you to select the available Column from the Dataset or we can create our own Expression by clicking the fx button
  • Data Type: By default Text is selected as Data type. You can change as per your requirement. 
  • Operator: Please select the operator you want to use (Like, <, <= etc)
  • Value: Please specify the value you want to check against the Expression. Please click on the fx button to write value Expression.
In this example, We are going to display the records whose [Color] is Black so, Please select the [Color] as Expression and Operator as Like and Value as Black.
Filtering data at Dataset Level in SSRS 2014 3
Click Ok button to finish configuring Filters at Dataset Level. Let us Preview the Report
Filtering data at Dataset Level in SSRS 2014 4
If you observe the above screenshot, it is displaying the 224 pages of data because remaining data is not satisfying the Filter Condition (their color is not Black).
Let us add one more filter at Dataset level, for better understanding. Here, We are going to display the records whose [Sales Amount] is between 600 and 1000 so, Please select the [Sales Amount] as Expression and Operator as Between and Value as 600 and 1000.
Filtering data at Dataset Level in SSRS 2014 5
Here [Sales Amount] is Float value so, We have to convert both 600 and 1000 to Decimal value. If you know the conversion function you can directly write it. If not, Please click on the fx button and use the built-in functions
TIP: If you want to delete the unnecessary filter, Please select the Filter and click on theDelete button.
Click Ok button to finish configuring Filters at Dataset Level. Let us Preview the Report
Filtering data at Dataset Level in SSRS 2014 6
If you observe the above screenshot, it is displaying the 10 pages of data because remaining data is not satisfying the 2 Filter Conditions.
Thank You for Visiting Our Blog

Grouping in SSRS Table Reports


In this article we will show you, How to Add Parent Groups and Child Groups to Tables Reports in SQL Server Reporting Services 2014.
We are going to use below shown report to explain, Grouping in SSRS Table Reports. Please refer SSRS Table ReportData Source and Dataset articles to understand the creation of Data Source, Dataset and Table report. If you observe the below screenshot, It was a normal Table report with Product Name, Color, Sales Amount and Tax Amount columns.
Repeat Headers on Each Page in SSRS 2014

Add Grouping to SSRS Table Reports

First, goto Row groups pane and right-click on the Details will open the context menu. From the context, Please select Add Group and then select the Parent Group option as shown in below screenshot
SSRS Grouping in Table Reports 1
Once you select the Parent Group option, a new Tablix group window will be opened to configure the grouping.
  • Group By: Here you have to specify the grouping column name. Either you can select the column name from drop down list or else click on the fx button to create an expression.
  • Add Group Header: Please check mark this option, If you want to add header to this group
  • Add Group Footer: Please check mark this option, If you want to add Footer to this group
Add Grouping to Table Reports in SSRS 2014
In this example, We are selecting English Product Category Name as a Parent group for this detailed row.
Add Grouping to Table Reports in SSRS 2014
Click Ok to finish creating Parent Group (English Product Category name). Click on the Preview button to see the report preview
Add Grouping to Table Reports in SSRS 2014
Now we will show you, How to Add Child Group to SSRS table Reports.
First, Select the English Product Category name in the Row Groups pane and right-click on it will open the context menu. From the context, Please select Add Group and then select the Child Group option as shown in below screenshot
Add Grouping to Table Reports in SSRS 2014
As we all know, English Product Sub Category name is a sub group of English Product Category Name so, We are selecting English Product Sub Category Name as a Child group for this row.
Add Grouping to Table Reports in SSRS 2014
Click Ok to finish creating Child Group (English Product Sub Category name)
From the below screenshot, You can see the created Row groups under the Row Group pane
Add Grouping to Table Reports in SSRS 2014
Click on the Preview button to see the report preview
Add Grouping to Table Reports in SSRS 2014
Thank You for Visiting Our Blog


In this article we will add grouping in SSRS Report.
1. First of all open Visual Studio 2010 than go to File–> New –> Project
Grouping in SSRS Report-1
2.  A New Project Window pops-up. Select Business Intelligence from installed templates and then select Report Server Project.
Grouping in SSRS Report-2
Now click on OK button.
3.  Then Right click on Reports Folder in your Solution Explorer and select Add New Report from context menu.
Grouping in SSRS Report-3
4. A Report Wizard Window will Pops-up. In that window, click on Next Button.
Grouping in SSRS Report-4
5. Now create shared data source as described in following link:
6. Now you can design query with the help of Query Builder or you can use readymade query. We are going to use readymade query.
 Grouping in SSRS Report-5
?
1
2
3
4
5
6
7
8
9
SELECT      C.FirstName + ' ' + C.LastName AS Employee, DATEPART(Year, SOH.OrderDate) AS OrderYear,
            DATEPART(Month, SOH.OrderDate)as OrderMonth,SUM(SOD.LineTotal) AS Sales
FROM        Sales.SalesOrderHeader SOH INNER JOIN
            Sales.SalesOrderDetail SOD ON SOH.SalesOrderID = SOD.SalesOrderID INNER JOIN
            Sales.SalesPerson SP ON SOH.SalesPersonID = SP.BusinessEntityID INNER JOIN
            HumanResources.Employee E ON SP.BusinessEntityID = E.BusinessEntityID INNER JOIN
            Person.Person C ON E.BusinessEntityID = C.BusinessEntityID
GROUP BY    C.FirstName + ' ' + C.LastName, SOH.SalesPersonID, DATEPART(Year, SOH.OrderDate),
            DATEPART(Month, SOH.OrderDate), DATENAME(Month, SOH.OrderDate)
7. Then Report Type Dialogue Box Open. Select Tabular Report type.
Grouping in SSRS Report-6
8. In next step we can select in which area we want fields to show in report.
Here we add Employee & OrderYear into Groups Section and OrderMonth & Sales into Details Section.
Grouping in SSRS Report-7
Then click on Next Button.
9. In next screen select Stepped layout.
Also checked  checkboxes of Include Subtotals and Enable Drill-down.
Grouping in SSRS Report-8
Then click on Next Button.
10. Then Select Table Style and then click on Next Button.
In next screen give the name of Report. Here you also find summary of our report.
Grouping in SSRS Report-9
Then click on Finish Button.
11. Now your Report Design will look like below:
Grouping in SSRS Report-10
Now delete Sum (OrderMonth) from both fields above because there is no need of sum of order month.
Grouping in SSRS Report-11

12. Then click on preview button. So your report will looks like below :
Grouping in SSRS Report-12
Congratulations! Our SSRS Report with Grouping is completed.