Friday, October 2, 2015

Custom Report Template in SSRS


SQL Server Reporting Services (SSRS) allows us to create custom report templates with the customize report layout and after creating that we can use that custom template every time when we creating a new report.
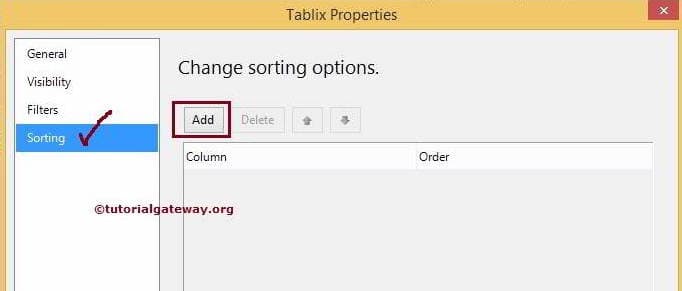
Go through below steps :
1. First of all open Visual Studio 2010 and open any ssrs project.In Solution Explorer Right Click on Reports and select Add –> New Item.
Custom Report Template in SSRS-1
2. Then select Report from Installed Templates and Give Name of that Report.
Custom Report Template in SSRS-2
3. Then click on Add button. So your blank report is added.Now right click on report area and select Add Page Header.
Custom Report Template in SSRS-3
After that again right click on report area and select Add Page Footer.
4. Now your Report Design will look like below :
Custom Report Template in SSRS-4
5. Now right click on Page Header area and select Insert –> Image.
Custom Report Template in SSRS-5
6. A Image Properties window pop-up.In that specify name of Image and then import any image from your hard drive.You can also give size of Image from this window.
Custom Report Template in SSRS-6
Then click on OK.
7. Now we will add some Built-In fields in Page Header and Footer.In Page Header we will add Report Name and in Footer we will add Execution Time, Overall Page Number & Overall Total Pages.You will find these built in fields under Built-In-Fields in Report Data Page.
After adding these fields in header and footer, your report design will look like below :
Custom Report Template in SSRS-7
So we are done with our custom template.
Now we need to place it in appropriate location so that it appears in Report Templates while creating a new project.
For Sql Server 2012 location is
C:\Program Files (x86)\Microsoft Visual Studio 10.0\Common7\IDE\PrivateAssemblies\ProjectItems\ReportProject
For Sql Server 2008 location is
C:\Program Files (x86)\Microsoft Visual Studio 9.0\Common7\IDE\PrivateAssemblies\ProjectItems\ReportProject
Now you need to copy your custom template (which is CustomTemplate.rdl file in your Report Project Folder) to above location.
8. Once you copied custom report template to appropriate location it will start showing as a report template on the New Item or Report Dialog box.
To check this ,try to add new item or report.
Custom Report Template in SSRS-8
9. Then click on Add button.So now your Report Layout automatically look like below :
Custom Report Template in SSRS-9
Congratulations! We successfully created Custom Report Template in SSRS.

Conditionally Setting Column Visibility in SSRS


Conditionally Setting Column Visibility in SSRS
In this article I will show you real example of the usage of Column Visibility property in SSRS. Column visibility property is used to show or hide the column in the report. Now in this article, we can use this property to allow the users to select columns what they want to see in a report instead of all columns means they can filter the columns in SSRS report.
In this article, We used Person Address Details Report which we created earlier.You can find this report in following article :
1. Open Visual Studio and Open SSRS Project. Then open Person Address Details Report or Create Report as described in above article.
2. Now in Report Data window right click on Parameter and select Add Parameter.
2-Conditionally Setting Column Visibility in SSRS
3. In Report Parameters Window, Enter name of parameter and check the check-box of Allow multiple values.
3-Conditionally Setting Column Visibility in SSRS
4. Now click on Available Values from left pane. Then select Specify Valuesand Add Label & Value as shown in below screenshot. Then click on OK button.
4-Conditionally Setting Column Visibility in SSRS
5. Now right click on First Tablix Column i.e. Name and select Column Visibility.
5-Conditionally Setting Column Visibility in SSRS
6. A Column Visibility window opens. In that select Show or hide based on an expression and then click on fx button as shown in below screenshot.
6-Conditionally Setting Column Visibility in SSRS
7. Enter following Expression in Expression Window.
=IIF(InStr(Join(Parameters!SelectColumn.Value,”,”),”Name“)=0,True,False)
7-Conditionally Setting Column Visibility in SSRS
Then click on OK button. Again click on OK button.
8. Now Repeat 5.6 & 7 steps for all the columns in report. In that you need to change value in above expression which is in Bold letter. After completing this action run your report. Now you can see the filter of columns in your report.
8-Conditionally Setting Column Visibility in SSRS
9. Now if you want to see column of Name, City & State then select appropriate values in SelectColumn Parameter and click on View Report button.
9-Conditionally Setting Column Visibility in SSRS
Congratulations! We successfully completed lesson of Conditionally Setting Column Visibility in SSRS.
If any query, let me know.
For contact information, go to following link :

Creating Calculated Fields in SSRS 2014


Calculated Fields

While creating reports, we might need information that is not directly available in the Database. For instance, we may have to show Profits to end-user but we don’t save Profits in our database. In these situations, we can create or add calculated fields to the existing Dataset and use them in SSRS reports.
TIP: SSRS allows us to use powerful Expressions to create Calculated Fields so, we can either use existing fields or create custom expression using expression window.
We are going to use below shown report to explain, How to create Calculated Fields in SSRS Reports. Please refer SSRS Table ReportData Source and Dataset articles to understand the creation of Data Source, Dataset and Table report. If you observe the below screenshot, It was a normal Table report with Product Name, Color, Sales Amount and Tax Amount columns.
Keep Headers Visible While Scrolling in SSRS 2014

Steps to Create Calculated Fields

First, Select the Report Dataset and right-click on the Dataset to open the context menu. From the context menu, Please select Add Calculated Fields.. option as shown below OR Click on the Dataset Properties option and then select the Fields tab
Calculated Fields in SSRS 2014
Once you click on the Add Calculated Fields.. option, a new window called Dataset Properties with Fields tab will be opened. If you observe the below screenshot, a new row with two empty text boxes under Field Name and Field Source will be added.
  • Field Name: The name you specify here will be displayed as Column name in your Dataset.
  • Field Source: This is the value we are going to display in Reports. We can assign static value or use the fx button to write the custom expression.
Calculated Fields in SSRS 2014
We assigned Field Name as Total and clicked the fx button to write the custom expression.
Calculated Fields in SSRS 2014
For now, we are going to add Sales Amount and Tax Amount as Total so, we set the expression value as
Calculated Fields in SSRS 2014
Click Ok to add the Expression. Next, we would like to show you, How to add one more Calculated Filed from this Dataset Properties window.
First, Click on the Add button will open the context menu with two options. Here we have to select the Calculated Filed option as shown below
Calculated Fields in SSRS 2014
Here, We assigned Field Name as Static and Field Source as 10000. It means, Static column will repeat 10000 to each and every row present in that report.
Calculated Fields in SSRS 2014
Click Ok to finish creating Calculated Fields in SSRS Dataset.
Next, We added the newly created calculated fields (Total and Static columns) to the SSRS Report as shown below
Calculated Fields in SSRS 2014
Click on the Preview button to see the report preview.
Calculated Fields in SSRS 2014
From the above screenshot you can observe that, Static Column is repeating 10000 to each every every column.
Thank You for Visiting Our Blog

Interactive Sorting in SSRS 2014


In SQL Server Reporting Services, Sorting is similar to SQL ORDER BY Clause. Interactive Sorting is used to provide the sorting control to end-user like we see in popular e-commerce websites like Amazon. Interactive Sorting provides Up & Down arrows to toggle between Ascending Order and Descending order.


In this article we will show you, How to enable Interactive Sorting (Sorting data at Text box level) in SQL Server Reporting Services 2014 with example.
TIP: It is always better to apply Sorting at Texbox level (Interactive Sorting) only because it will allow the user to dynamically sort the records.
We are going to use below shown report to explain, Interactive Sorting in SSRS  Reports. Please refer SSRS Table Report article to understand the Data Source and Dataset we used for this report. If you observe the below screenshot, It was a normal report with Product Name, Color, Sales Amount and Tax Amount columns.
Interactive Sorting in SSRS 2014
If you observe the above screenshot, it is displaying the data in a unsorted manner.

Interactive Sorting in SSRS 2014

Select the Header Textbox of the SSRS report and Right click on it will open the context menu. Please select the Text Box Properties.. option from it
Interactive Sorting in SSRS 1
Once we click on the Text Box Properties.. option, a new Text box Properties window will be opened. Please select the Interactive Sorting tab as shown in below screenshot.
Interactive Sorting in SSRS 2
Click on the Add button will display the below properties
  • Enable interactive sorting on this text box: If you want to enable the interactive sorting on this selected text box then please select this option as shown in below screenshot .
  • Detail Row: If you want to enable the interactive sorting on Details Row then please select this option.
  • Groups: If you want to enable the interactive sorting on Grouping Column then please select this option.
  • Sort by: It will allow you to select the available Column from the Dataset or we can create our own Expression by clicking the fx button. For instance, If you want to sort the data by Product Name then select that column name.
NOTE: Interactive Sorting is applied to individual Columns. If you select wrong column asSort By then you may end up with wrong results. For instance, you enabled the Interactive Sorting on Product Name and assigned Color column as Sort by. If this is the case then, when you click on Product name data will be sorted by color instead of Product Name.
In this example, We are going to apply interactive Sorting on [English Product Name] so, Please select the [English Product Name] as Sort By Expression.
Interactive Sorting in SSRS 4
Click Ok button to finish enabling Interactive Sorting for the Product name. Let us Preview the Report
Interactive Sorting in SSRS 5
If you observe the above screenshot, data is sorted by the Product Name in the Ascending Order.
Let us click the down arrow to sort the data in Descending order
Interactive Sorting in SSRS 6
Let us enable the Interactive Sorting for the remaining columns such as Color, Sales Amount and Tax Amount using above mentioned steps and see the preview
Interactive Sorting in SSRS 7
This is how, We can provide the Dynamic sorting option to end users.
Thank You for Visiting Our Blog

Sorting in SSRS 2014


In SQL Server Reporting Services, Sorting is similar to SQL ORDER BY Clause. Sorting is used to Sort the records as per the given Expression in Tablix properties and then Sorted data will be displayed in the final SSRS Report.
In this article we will show you, How to Sort the data at Table level (or tablix level) in SQL Server Reporting Services 2014 with example.
TIP: It is always better to apply Sorting at Texbox level (Interactive Sorting) only because it will allow the user to dynamically sort the records.
We are going to use below shown report to explain, Sorting the data at Tablix level. Please refer SSRS Table Report article to understand the Data Source and Dataset we used for this report. If you observe the below screenshot, It was a normal report with Product Name, Color, Sales Amount and Tax Amount columns.
Sorting in SSRS 2014
If you observe the above screenshot, it is displaying the data in a unsorted manner.

Sorting data at Tablix Level in SSRS 2014

Select the Top Left Corner of the report and Right click on it will open the context menu. Please select the Tablix Properties.. option from it
Sorting in SSRS 1
Once we click on the Tablix Properties.. option, a new Tablix Properties window will be opened. Please select the Sorting tab as shown in below screenshot.
Sorting in SSRS 2
Click on the Add button will display the below properties
  • Sort by: It will allow you to select the available Column from the Dataset or we can create our own Expression by clicking the fx button. For instance, If you want to sort the data by Product Name then select that column name.
  • Order: By default A to Z is selected as Order type. You can change as per your requirement. A to Z means Ascending Order and Z to A means Descending Order
Sorting in SSRS 3
In this example, We are going to Sort the records by [English Product Name] in the Ascending Order so, Please select the [English Product Name] as Sort By Expression and A to Z as Order.
Sorting in SSRS 4
Click Ok button to finish configuring Sorting at Tablix Level. Let us Preview the Report
Sorting in SSRS 5
If you observe the above screenshot, data is sorted by the Product Name in the Ascending Order.
Let us add one more Sorting option at Tablix level, for better understanding. Here, We are going to Sort the data by [Sales Amount] in Descending Order and then sort by [English Product Name] in the Ascending Order.
Sorting in SSRS 6
TIP: If you want to delete the unnecessary Sorting Options, Please select the Sort Condition and click on the Delete button.
Click Ok button to finish Applying Sorting at Tablix Level. Let us Preview the Report
Sorting in SSRS 7
If you observe the above screenshot, Data is Sorted by the Sales Amount in Descending order and then sorted by English product name in the Ascending order.
Thank You for Visiting Our Blog

Filters at Tablix Level in SSRS 2014


In SQL Server Reporting Services, Filters are similar to SQL WHERE Clause. Filters is used to restrict the Records displayed by the Report. SSRS supports two types of Filters: Filters at Tablix Level and Filters at Dataset Level.
In this article we will show you, How to filter the data at Table level (or tablix level) in SQL Server Reporting Services 2014 with example.
TIP: It is always better to apply filters at Tablix level only because it will only be applicable to this table only rather than all the tables using that Dataset.
We are going to use below shown report to explain, filtering the data at Table level. Please refer SSRS Table Report article to understand the Data Source and Dataset we used for this report. If you observe the below screenshot, It was a normal report with Product Name, Color, Sales Amount and Tax Amount columns.
Filters at Table Level in SSRS 2014
If you observe the above screenshot, it is displaying the 1373 pages of data.

Filtering data at Tablix Level in SSRS 2014

Select the Top Left Corner of the report and Right click on it will open the context menu. Please select the Tablix Properties.. option from it
Filters at Table Level in SSRS 1
Once we click on the Tablix Properties.. option, a new Tablix Properties window will be opened. Please select the Filters tab as shown in below screenshot.
Filters at Tablix Level in SSRS 2
Click on the Add button will display the below properties
  • Expression: It will allow you to select the available Column from the Dataset or we can create our own Expression by clicking the fx button
  • Data Type: By default Text is selected as Data type. You can change as per your requirement. 
  • Operator: Please select the operator you want to use (Like, <, <= etc)
  • Value: Please specify the value you want to check against the Expression. Please click on the fx button to write value Expression.
Filters at Tablix Level in SSRS 3
In this example, We are going to display the records whose [Sales Amount] is Greater than or Equal to 3500 so, Please select the [Sales Amount] as Expression and Operator as >= and Value as 3500.
Filters at Tablix Level in SSRS 4
Here [Sales Amount] is Float value so, We have to convert 3500 to Decimal value. If you know the conversion function you can directly write it. If not, Please click on the fx button and use the built-in functions
Filters at Tablix Level in SSRS 5
Click Ok button to finish writing the Value Expression.
Filters at Tablix Level in SSRS 6
Click Ok button to finish configuring Filters at Tablix Level. Let us Preview the Report
Filters at Tablix Level in SSRS 8
If you observe the above screenshot, it is displaying the 36 pages of data because remaining data is not satisfying the Filter Condition.
If you want to delete the unnecessary filter, Please select the Filter and click on the Deletebutton as shown in below screenshot
Filters at Tablix Level in SSRS 8
Thank You for Visiting Our Blog