1. First of all open Visual Studio 2008 then Go to File -> New Project to create new project.

2. A New Project Window will pop-up. Select Business Intelligence Projectsand then select Report Server Project. Give Project Name and then click on OK.

3. Now Right click on Reports and select Add -> New Item.

4. Now Select Report Wizard from Visual Studio Installed Templates and give Report Name.

5. Now click on Add. It will pop-up Report Wizard.

6. Then Click on Next Button. Now we are going to connect sql server. We can also connect to other data source like oracle, xml etc. Here we select Microsoft Sql Server.

7. Then click on Edit button. Now we configure details related to our database like database server name, credentials and target database. After that we can verify it with ‘Test Connection’ to check whether connection is done or not.

8. Then click on Next. It will show Query Builder Window.

9. In our case, Query is as below :
1
2
3
4
5
6
7
8
9
10
11
12
| SELECT PC.Name AS ProdCat, PS.Name AS SubCat, DATEPART(yy, SOH.OrderDate) AS OrderYear, 'Q' + DATENAME(qq, SOH.OrderDate) AS OrderQtr, SUM(SOD.UnitPrice * SOD.OrderQty) AS SalesFROM Production.ProductSubcategory PS INNER JOIN Sales.SalesOrderHeader SOH INNER JOIN Sales.SalesOrderDetail SOD ON SOH.SalesOrderID = SOD.SalesOrderID INNER JOIN Production.Product P ON SOD.ProductID = P.ProductID ON PS.ProductSubcategoryID = P.ProductSubcategoryID INNER JOIN Production.ProductCategory PC ON PS.ProductCategoryID = PC.ProductCategoryIDWHERE (SOH.OrderDate BETWEEN '1/1/2002' AND '12/31/2009')GROUP BY DATEPART(yy, SOH.OrderDate), PC.Name, PS.Name, 'Q' + DATENAME(qq, SOH.OrderDate), PS.ProductSubcategoryID |

You can also build your query with the help of Query Builder.
10. Then click on Next, here select Matrix type from Report Type.

11. Then Click on Next.
Here we add OrderYear & OrderQtr in Columns section, ProdCat & SubCat in Rows section
and Sales in Details Section.
Check the Enable Drilldown if you want the facility of drilldown.

12. Then click on Next. Select Matrix Style. Here we select Slate.

13. Then click on Next. Here you can find summary of our Report.

14. Then select Finish. Now your report design screen will look like below :

15. Click on Preview Tab to see the preview of Report.

Congratulations! Our Matrix Report is Completed.
SSRS Matrix Report
by suresh
In this article we will show you, How to create Matrix Report in SQL Server Reporting Services 2014. Below screenshot will show you the, Data Source and Dataset we used for this report.
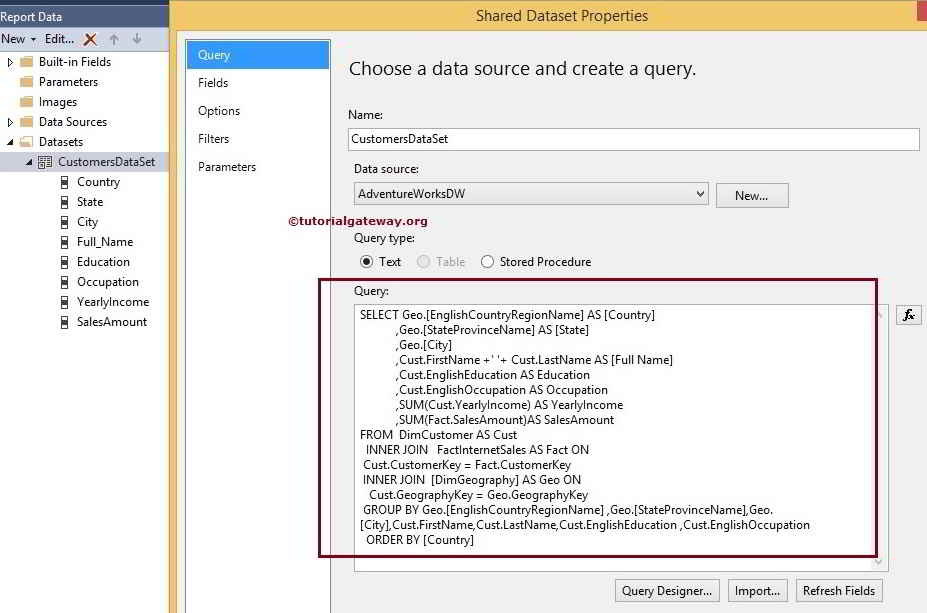
SQL Command we used in the above screenshot is:
T-SQL QUERY
1
2
3
4
5
6
7
8
9
10
11
12
13
14
15
16
17
18
19
20
21
22
23
24
25
|
SELECT Geo.[EnglishCountryRegionName] AS [Country]
,Geo.[StateProvinceName] AS [State]
,Geo.[City]
,Cust.FirstName +' '+ Cust.LastName AS [Full Name]
,Cust.EnglishEducation AS Education
,Cust.EnglishOccupation AS Occupation
,Cust.Gender
,SUM(Cust.YearlyIncome) AS YearlyIncome
,SUM(Fact.SalesAmount)AS SalesAmount
FROM DimCustomer AS Cust
INNER JOIN
FactInternetSales AS Fact ON
Cust.CustomerKey = Fact.CustomerKey
INNER JOIN
[DimGeography] AS Geo ON
Cust.GeographyKey = Geo.GeographyKey
GROUP BY Geo.[EnglishCountryRegionName]
,Geo.[StateProvinceName]
,Geo.[City]
,Cust.FirstName
,Cust.LastName
,Cust.EnglishEducation
,Cust.EnglishOccupation
,Cust.Gender
ORDER BY [Country]
|
Creating Matrix Report without using Report Wizard in SSRS 2014
Please refer SSRS Table Report to understand the creation of basic Report. Drag and drop Matrix from SSRS toolbox to the Data region.
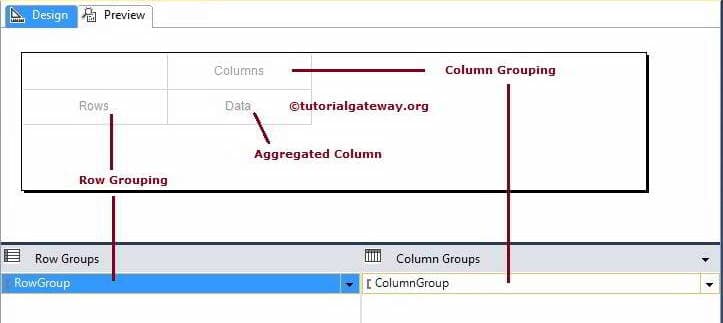
We can add the Column names to the Matrix Grouping in three ways:
- We can Drag the Column name from Report data to the Row Grouping or Column Grouping Column.
- We can drag and Drop the Column name from Report data to the Row Grouping Pane or Column Grouping Pane.
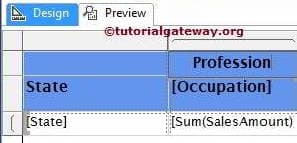
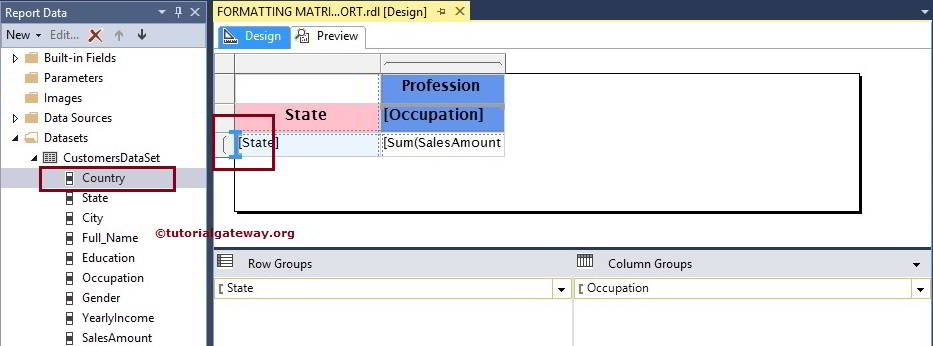
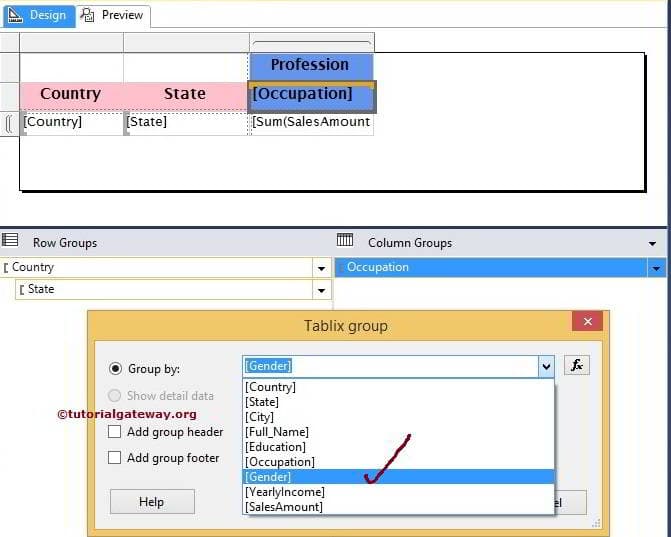
- When we click on particular cell, it will open the context menu displaying available column names in that Dataset. We can select the required column from the list as shown in below screenshot. Here we are selecting State Column as a Row Groupingitem
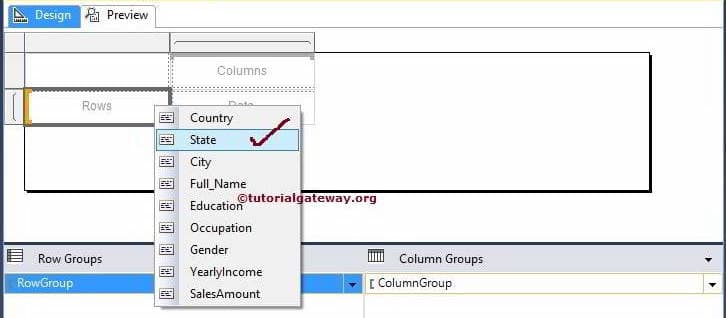
Now, we are selecting Occupation Column as a Column Grouping item

and we are selecting Sales Amount Column as a Data item.

NOTE: When you add Column to Data Column, Reporting Server will automatically aggregate the data. If you want to change the aggregate functions then goto fx Expression and change them accordingly.
We successfully created our first SSRS Matrix report. If you observe the below screenshot, we have done the formatting as well. Please refer Format Fonts and Background Color of a Textbox article to understand them.

Click on the Preview button to see the report preview

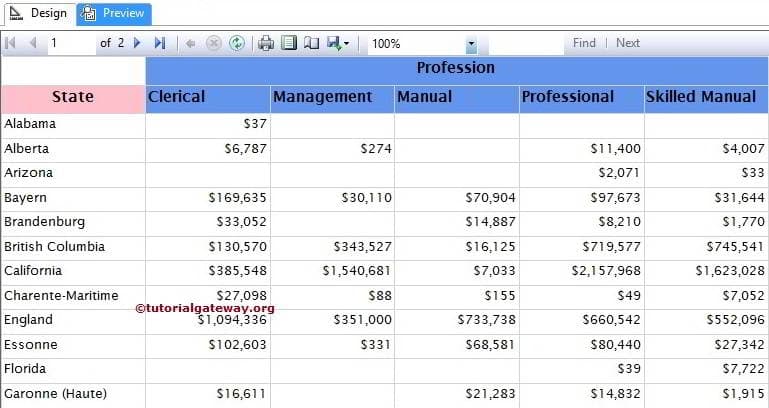
Add Header Column For Column Grouping in SSRS Matrix Report
If you observe the above screenshot we all know that Clerical, Management, Manual etc are the Customer Occupation. What if we don’t know or what if we want to provide extra information to the user about each column? In these situations we have to add extra row (providing Header Details of the columns).
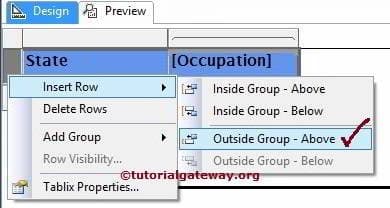
Please select the Header column of a report and then right-click on it to open the context menu. From the menu, Please select the Insert Row option. Here we have multiple option and their functionalities are:
- Inside Group – Above: This option will insert a new row on top of the Header column and inside the Group. Inside the Group means Header text will be repeated for each and every row
- Inside Group – Below: This option will insert a new row below the Header column and inside the Group.
- Outside Group – Above: This option will insert a new row on top of the Header column and Outside the Group. Outside the Group means Header text will be static and will not be repeated for each and every row
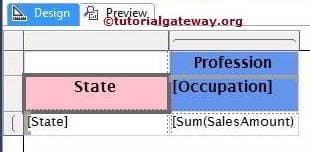
We named the Header text as Profession as shown below
If you observe the below screenshot, we have done the background formatting.
Click on the Preview button to see the report preview
Thank You for Visiting Our Blog


Creating SSRS Matrix Report using Report Wizard
by suresh
In this article we will show you, How to create Matrix Report using report Wizard in SQL Server Reporting Services.
Creating Matrix Report using Report Wizard in SSRS 2014
After creating New SSRS Project, We have three folders in the solution explorer such asShared Data Sources, Shared Datasets and Reports. Reports folder is enough to design a basic report.
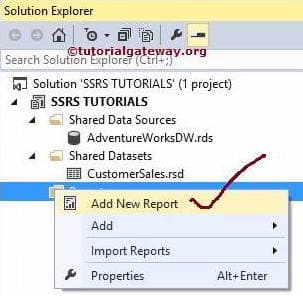
When we right-click on Reports folder it provides various options to design reports.
- Add New Report: Open up the Report wizard to design report.
- Add: Gives us the choice to choose whether we want to design report using Report Wizard or an empty report.
- Import Reports: We can import reports from the file system.
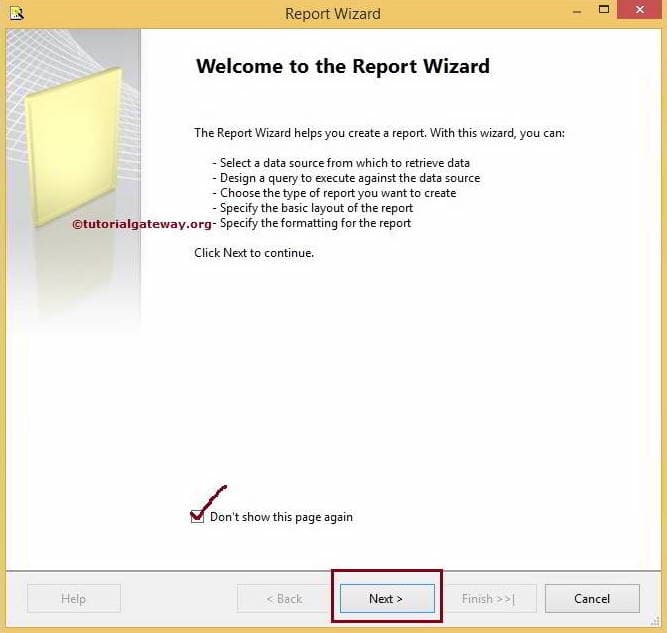
Here we are selecting the first option Add New Report. Once you click on this option, it will open the Report wizard as we shown in below screenshot. First page is a Welcome screen, If you don’t want to see this page again, Please tick mark the Don’t show this page againoption.
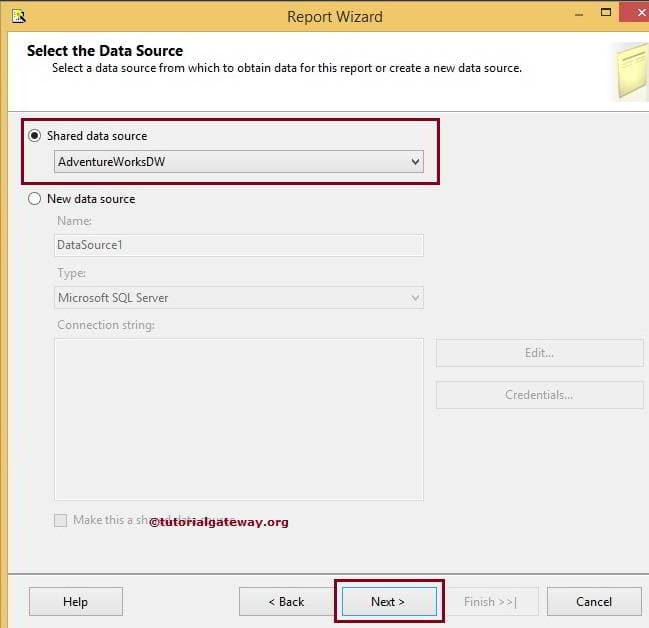
Select the Data Source: This page is used to configure the Data Source. Here we have two options:
- Shared data Source: If you already created the Shared data Source, Please select the data source name from the drop down list.
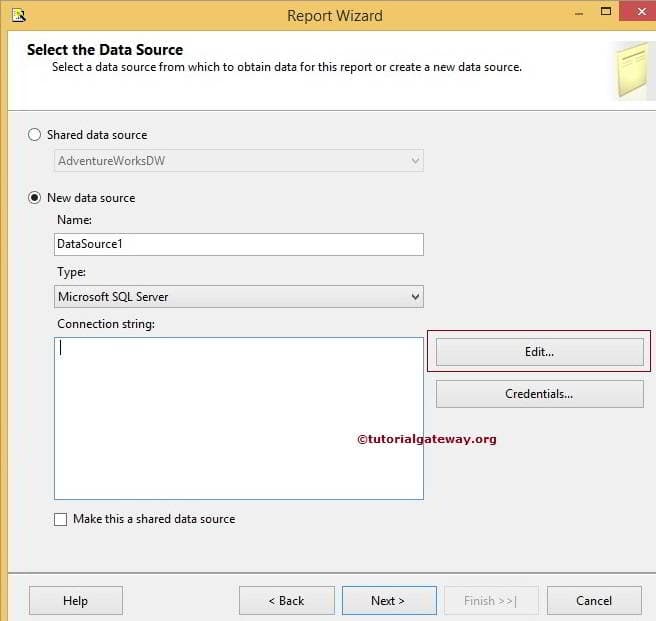
- New data Source: If you haven’t already created the data Source, Please select this option and create New data source.
If you select the New data Source then following properties will come into play. Please refer Shared Data Source in SSRS article to understand the properties in detail.
Design Query
This page is used to write the SQL Query to extract the data from the Data Source. If you are not familiar with SQL Queries then click on the Query Builder button. Please refer SSRS Query Designer article to understand the steps involved in designing SQL Queries
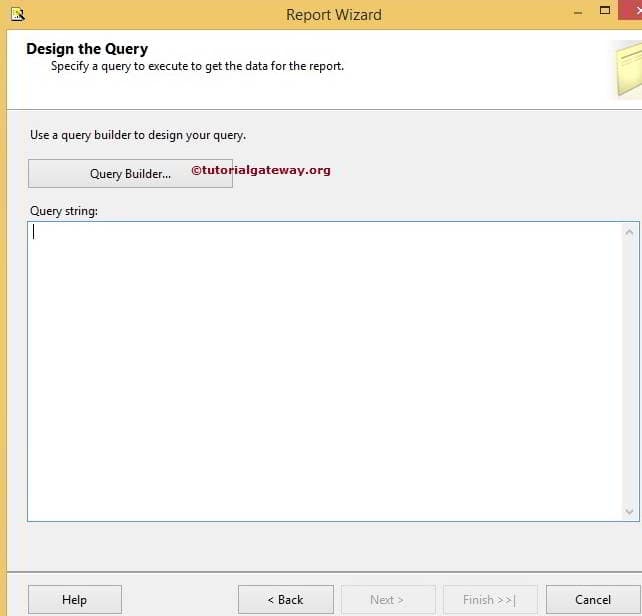
In this example we are coping the SQl Query from SQL server Management Studio to Query String empty space
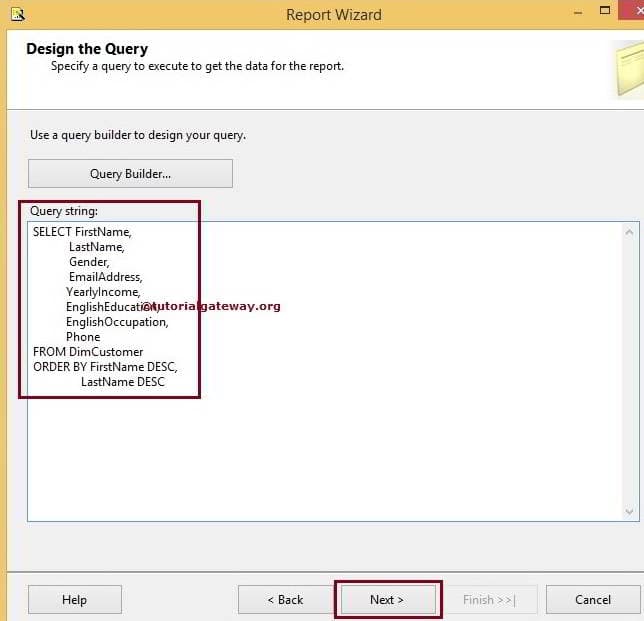
SQL Command we used in the above screenshot is:
1
2
3
4
5
6
7
8
9
10
11
|
SELECT FirstName,
LastName,
Gender,
EmailAddress,
YearlyIncome,
EnglishEducation,
EnglishOccupation,
Phone
FROM DimCustomer
ORDER BY FirstName DESC,
LastName DESC
|
Select the Report Type: Please select the Report type you wish to design.
- If you are designing Table report, Please select the Tabular option.
- If you are designing Matrix report, Please select the Matrix option.

Design the Matrix: Properties involved in this page are:
- Available Fields: List of columns we got it from the SQL Query we designed before
- Page: If you place anything, it will start new page for every new value
- Columns: If you want to perform any Column grouping operations then place those columns in this place. Here, We are placing Gender in Column Grouping
- Rows: If you want to perform any Row grouping operations then place those columns in this place. Here, We are placing English Occupation and English Education in Row Grouping
- Details: Columns added to this tab will be shown as output columns in the Table report. We are adding Sales Amount in this detailed tab
- Remove: This button will remove column names from Page, Grouping and Details

NOTE: Please check mark the Enable Drilldown option if you want to enable the Drill down operations otherwise, uncheck it
Choose the Table Style: You can select your own style as per your requirements. For now, we are selecting Corporate style

Completing the Wizard: Please provide valid name for the report and click on the finish button. Here, We assigned SSRS Matrix Report using Report Wizard name as report name

If you observe the above screenshot, You can see the SQL Query, Report Type, Data Source and layout Type details.
Click Finish button to finish creating SSRS Matrix report using report wizard.

From the above screenshot you can observe the, Final report with Row Groups and Column Groups.
TIP: If you want to add few more Row or Column Groups, you can add them in Row groupspane or Column Groups pane at the bottom
Click on the Preview button to see the report preview.

If you observe the above screenshot, It looks good but there is no Header text for English Occupation and English Education columns. It may confuse the end-user so, Lets add the header text.
Select the two Grouping cells and right-click on it will open the context Menu. Please select the Split Cells option and write the Header names in the Empty text boxes.

Click on the Preview button to see the report preview. Now, we can understand the Header Data

TIP: If you uncheck the Enable Drill down option in matrix wizard then, we have to apply manually.
Thank You for Visiting Our Blog


Grouping in SSRS Matrix Reports
by suresh
In this article we will show you, How to Add Row Groups and Column Groups to already created Matrix Reports in SQL Server Reporting Services 2014.
We are going to use below shown report to explain, Grouping in SSRS Matrix Reports. Please refer SSRS Matrix Report, Data Source and Dataset articles to understand the creation of Data Source, Dataset and Matrix report. If you observe the below screenshot, It was a normal Matrix report with State Column as Row Group and Occupation as Column Group.
Add Grouping to SSRS Matrix Reports
In this example we are going to add Country column to the Row Grouping and Gender column to Column Grouping. We can add the Column names to the Matrix Grouping in multiple ways:
- We can drag and Drop the Column name from Report data to the Row Grouping Pane or Column Grouping Pane in the position we want. For example, Drop the column name on top of existing group to add parent grouping.
- We can Drag the Column name from Report data to the Row Grouping or Column Grouping Column. For example, Drop the column name besides the existing group to add parent grouping as shown below.
NOTE: It is not a good practice to use above method because if you change the direction of aBlue bar, it will give wrong result.
Third method, goto Row groups pane and right-click on the State Group will open the context menu. From the context, Please select Add Group and then select the Parent Groupoption as shown in below screenshot (If you want to add child group, select Child Group option).
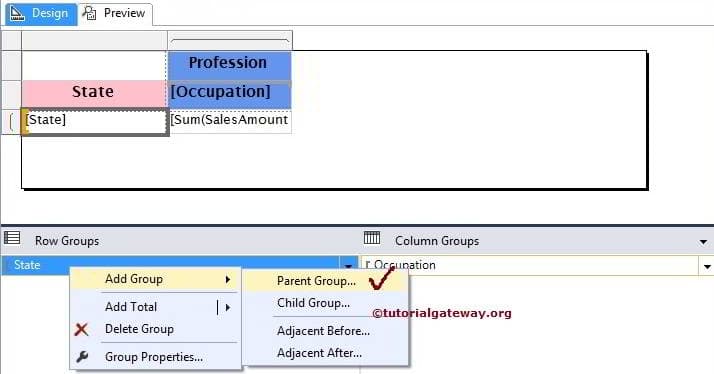
Once you select the Parent Group option, a new Tablix group window will be opened to configure the grouping.
- Group By: Here you have to specify the grouping column name. Either you can select the column name from drop down list or else click on the fx button to create an expression. In this example we are adding Country as Grouping column so we selected the same from the list
- Add Group Header: Please check mark this option, If you want to add header to this group
- Add Group Footer: Please check mark this option, If you want to add Footer to this group
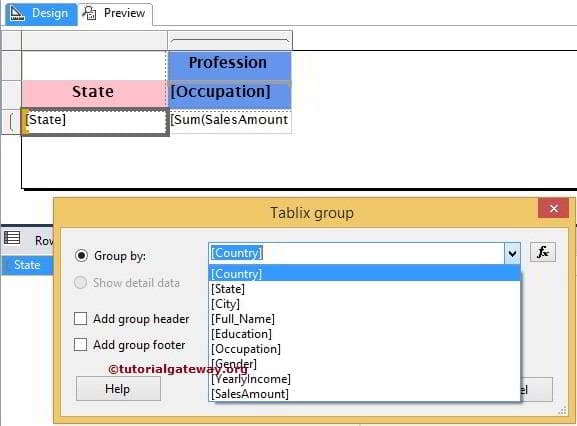
Click Ok to finish Adding Row Grouping to existing SSRS Matrix.
Add Column Grouping
Goto Column groups pane and right-click on the Occupation Group will open the context menu. From the context, Please select Add Group and then select the Parent Group option as shown in below screenshot (If you want to add child group, select Child Group option).

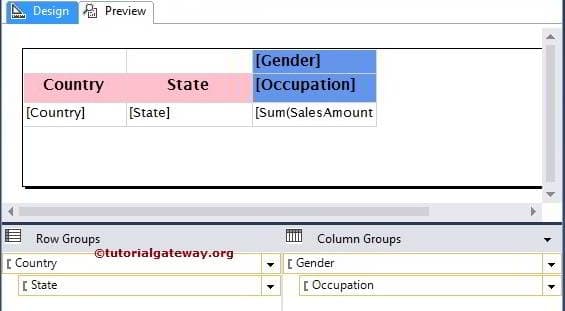
In this example we are adding Gender as Column Grouping column so we selected the same from the list
Click Ok to finish Adding Column Grouping to existing SSRS Matrix. From the below screenshot, You can see that we added Row groups and Column Groups to existing Matrix and we also done some Formatting as well.
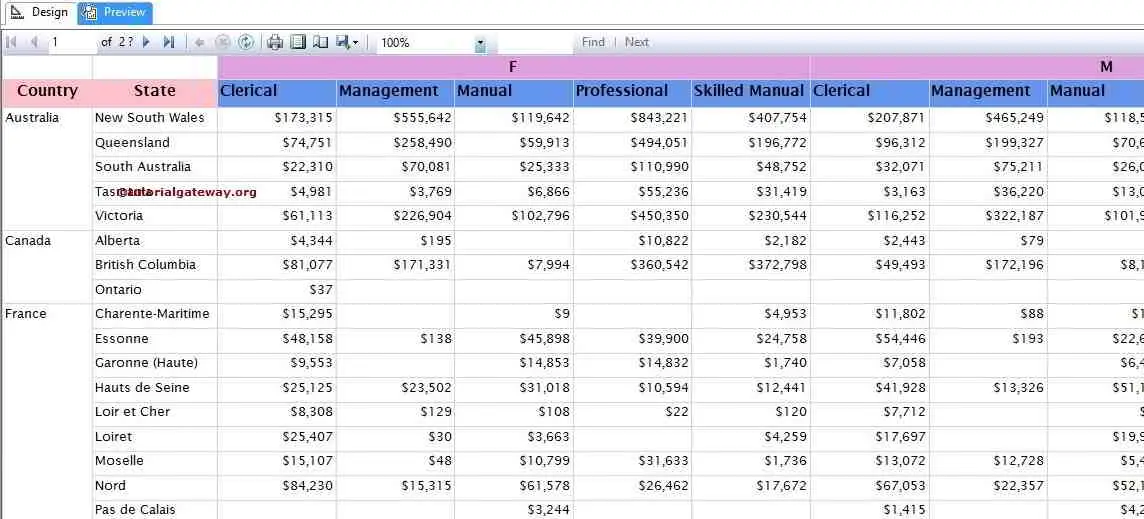
Click on the Preview button to see the report preview
Thank You for Visiting Our Blog


Drill Down Matrix Report in SSRS 2014
by suresh
In this article we will show you,
- How to add Column Totals to Matrix reports?
- How to add Row Totals to Matrix reports?
- How to add Grand Total to Matrix reports?
- How to Enable Drill Down Operations on Matrix Report manually?
We are going to use below shown report to Enable the Drill Down in SSRS Matrix Reports. Please refer SSRS Matrix Report, Data Source and Dataset articles to understand the creation of Data Source, Dataset and Matrix report. If you observe the below screenshot, It was a normal Matrix report with Country, State Column as Row Group and Gender, Occupation as Column Group.
Add Totals to SSRS Matrix Report
Right click on the Aggregated data column will open the context menu with multiple option. Please select the Add Total Option and then choose Row or Column as per your requirement. Here we are selecting Row it means, It will generate new Row below the existing row withRow Total

Next, we are selecting Column it means, It will create new column on right side to the existing row with Column Total

TIP: You can always change the default aggregate function SUM to other function by selecting the fx Expression from the above screenshot.
We can add the Grand total by selecting the empty cell in between the Row Total and Column Total and add the Sales Amount column to that cell as shown in below screenshot.

We changed the Background Color of the Grand Total cell to show you the, difference between Row, Column and Grand Total. Click on the Preview tab to see the Report Preview

Enable Drill Down in SSRS Matrix Report
It will be very easy to enable Drill Down option when we are creating reports using Report Wizard but to enable manually we need some extra effort. In this example we will show you, How to hide State Names and Occupation Names and
- Allowing user to select the Country Name to show or hide the state names
- Allowing user to select the Gender Name to show or hide the Occupation / Profession Column Names
First, goto Row groups pane and right-click on the State Group will open the context menu. From the context, Please select Group Properties.. option as shown in below screenshot.

Once you select the Group Properties.. option, a new window will be opened to configure the Group Properties. Please select the Visibility tab on the left hand side.

Visibility tab have multiple options:
- Show: When you run the report initially, If you want to show the state names then select the Show option
- Hide: When you run the report initially, If you want to Hide the state names then select the Hide option. In this example, we want to hide the state names initially so we selected this option.
- Show or Hide based on an Expression: You can write your own expression to show / hide the state names by clicking fx button.
- Display can be toggle by this report time: If you select this option, State names will be show/hide based on the report item we selected here. In this example, we want to toggle the state names based the Country names selected by the user so select the Country column from the list as shown below.

Now, Goto Column groups pane and right-click on the Occupation Group and select the Visibility tab on the left hand side. In this example, we want to toggle the Occupation column names based on Gender selected by the user so select the Gender column from the list as shown below.

Click Ok to finish enabling the Drill down functionality to Matrix report Manually.

Click on the Preview tab to see the Report preview. If you observe the below screenshot, State Names and Occupation Names are not displaying and we have + symbol beside the Country names and Gender Names to expand them.

Once you click on the + symbol, corresponding state names will be displayed.

Let us preview the whole report.

Thank You for Visiting Our Blog