Friday, October 2, 2015

Repeat Headers on Each Page in SSRS 2014


In this article we will show you, How to Repeat Headers on Each Page in SQL Server Reporting Services 2014.

How to Repeat Headers on Each Page in SSRS 2014?

We are going to use below shown report to explain, Repeat Headers on Each Page in SSRS Reports. Please refer SSRS Table Report, Data Source and Dataset articles to understand the creation of Data Source, Dataset and Table report. If you observe the below screenshot, It was a normal Table report with Product Name, Color, Sales Amount and Tax Amount columns.
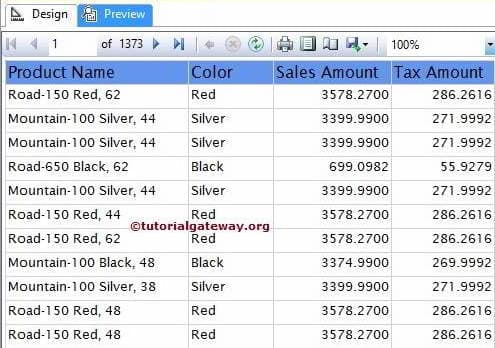
Repeat Headers on Each Page in SSRS 2014
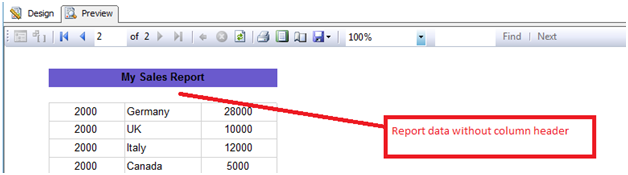
If we navigate to second page or any other page  we are unable to see the row headers. This become very problematic for the end-user to identify which column data belongs to Sales and Tax as shown in below screenshot.
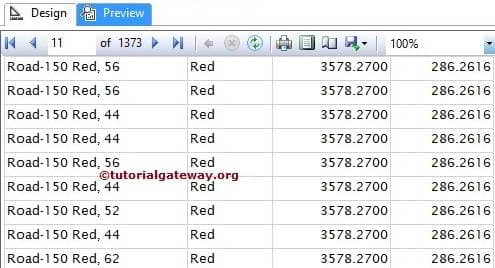
Repeat Headers on Each Page in SSRS 2014
To display the row headers on each and every page, We have to select the Header from theRow Group pane. By default, only detail rows will be shown in row group pane. In order to display the Header group, Click on the down arrow and select the Advanced Mode from theColumn Group pane as shown in below screenshot
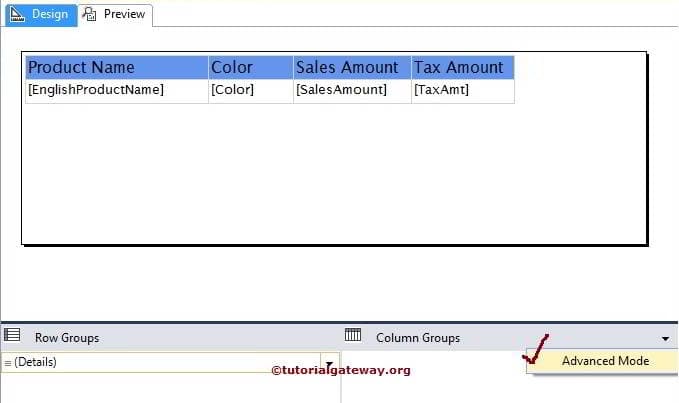
Repeat Headers on Each Page in SSRS 2014
Once you Click on the Advanced Mode, it will show the static columns (Header columns) in both row and column group. Please select the static column presented in row group pane (Header Row Group) and go to the properties of this static column
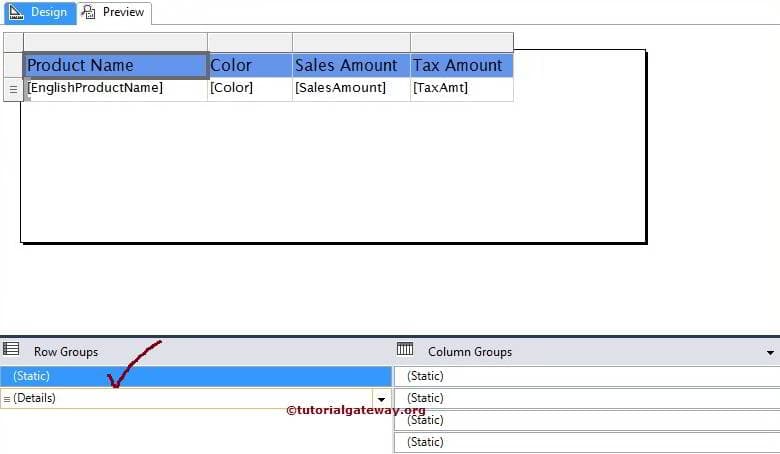
Repeat Headers on Each Page in SSRS 2014
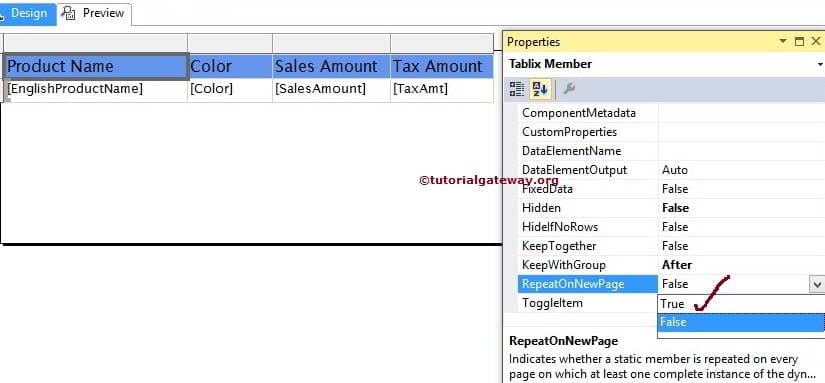
Please select the RepeatOnNewPage option and then, Change the RepeatOnNewPage option from default False to TRUE. It will allow the Header text to repeat on every single page in SSRS Report
Repeat Headers on Each Page in SSRS 2014
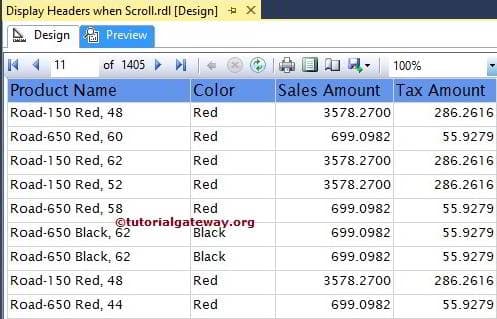
Click on the Preview button to see the report preview.
Repeat Headers on Each Page in SSRS 2014
If you observe the above screenshot, We are showing 11th page and the report is displaying Header text.
Thank You for Visiting Our Blog


Currently I am working in one SSRS Tablix Report. In that report, I stuck up with the issue that is Table Header is not repeating on every page. I set theRepeatColumnHeaders property to True but it doesn’t make any effect on my report.
Solution :
In this scenario, we have to set the some properties of static member of the row groups.
To see the static members of the row groups of the tablix, select tablix and click on the small drop down arrow on the right side of the Row Groups/Columns Groups header. Then select Advanced Mode.
Please see below screenshot.
1-Repeat Table Header on Each Page in SSRS
Now you can see the static members of row groups. Now select 1st static member. After selecting 1st member, top left cell of the tablix will be selected in the report designer.
2-Repeat Table Header on Each Page in SSRS
Now press F4 or manually open property page. In that, set propertyRepeatOnNewPage to True. Also set KeepWithGroup property to After.
3-Repeat Table Header on Each Page in SSRS
Now run your report. You will see that your table header will repeat on every page of report.
If still issue is not solved then set FixedData property to True in property page of first static member in row group. It will reproduce table header on every page of report.
4-Repeat Table Header on Each Page in SSRS
Sometimes you don’t need to set all three properties, but it doesn’t do any harm so let’s set all three properties.
If you find any similar issue after setting this properties, let me know.
For contact information, go to following link :
http://bhushan.extreme-advice.com/about-bhushan-shah/


1.     Background

The purpose of this article is to provide a way to display column headers on each and every page of the report. By using the page break feature of SSRS, we can show the report in no. of pages in place of having same report in single page. Page break is very useful with bulky report where large no. of records need to be shown. Page beak helps us to set pagination but it does not ensure that column headers for the report should come on each page of the report. A report without column headers in all the pages may create lot of confusion to the users.

2.     How to display column headers on each page of the report?   


We can achieve it by using the “KeepwithGroup” & “RepeatOnNewPage” properties of the grouping pane.

 Below is a simple report having 10 records:


After implementing the page break for 5 records per page, Report will look like the below one:

Page No-1


 Page No-2


3.     Steps to display column header on each page of the report


                    I.            Go to the Grouping paneรจ there we can see a down arrow, click on the arrow to go to Advance mode


                  II.            Once you click on the “Advance Mode”, we can see the static members for rows & columns within grouping pane.


                III.            Select static member of Row Groups and go to the property window. We need to change the below properties:

·         KeepwithGroupรจ After

·         RepeatOnNewPageรจTrue


Note:
KeepwithGroupรจAfter for Group Header

KeepwithGroupรจBefore for Group Footer


                IV.            Now preview the report


Page-1


Page-2


4.     Conclusion


By using advance mode properties of Grouping pane e.g . “KeepwithGroup” and “RepeatOnNewPage”, we can display column headers on each page of the report.

 ----------------------------------------------------End of Article---------------------------------------------------

Format Fonts and Background Color of a Textbox in SSRS 2014


In this article we will show you, How to change the Font Style, Font Color, Font Size, Font Family, Font Weight and Background Color of a Textbox in SQL Server Reporting Services2014 with example.
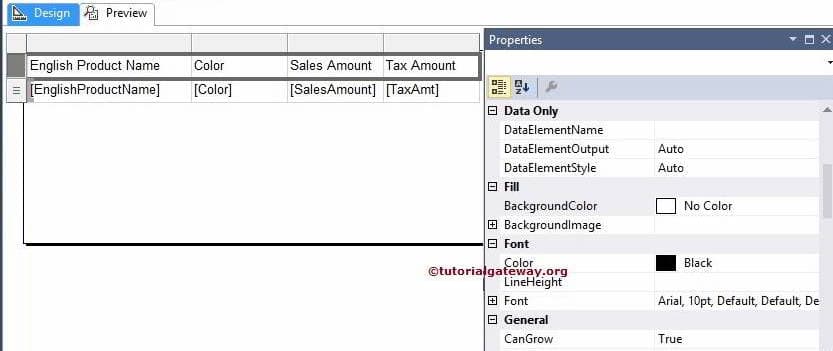
To explain the available Format options, We are going to use below shown report. Please refer SSRS Table Report article to understand the Data Source and Dataset we used for this report. If you observe the below screenshot, It was a normal report with Product Name, Color, Sales Amount and Tax Amount columns.
Format Fonts and Background Color of a Textbox in SSRS 2014
If you observe the above screenshot, it is displaying the correct data but not attractive to impress the end-user.

Formatting Textbox Fonts and Background Color in SSRS 2014

Select the Header Row and go to the Properties as shown in below screenshot
Format Fonts and Background of a Textbox in SSRS 1
Background Color
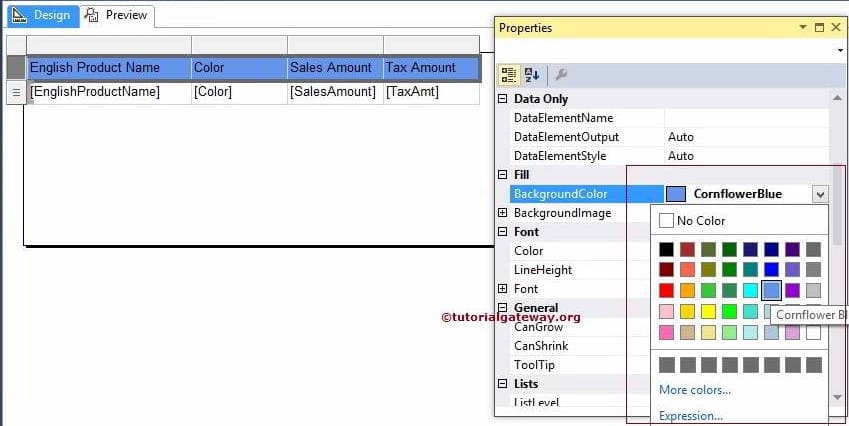
To change the Background color, Goto BackgroundColor Property and select the required color. Here we are selecting CornflowerBlue
Format Fonts and Background of a Textbox in SSRS 2
Font Color
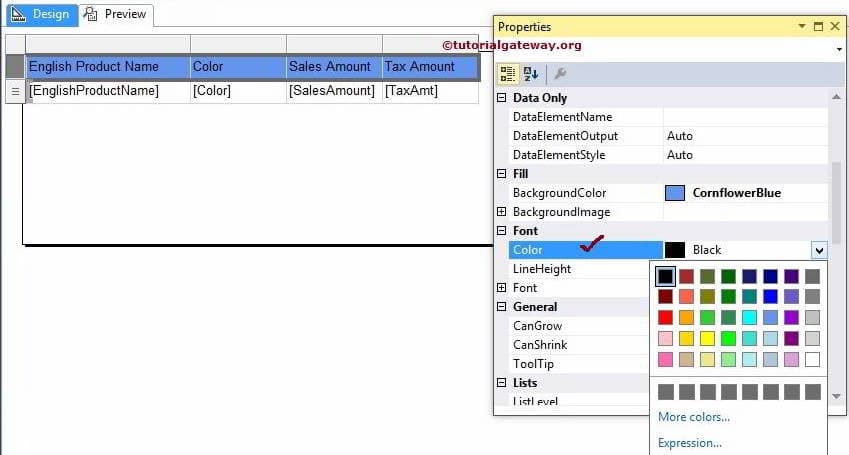
To change the Font color, Goto Font Color Property and select the required color. Here we are leaving the Default Black color
Format Fonts and Background of a Textbox in SSRS 3
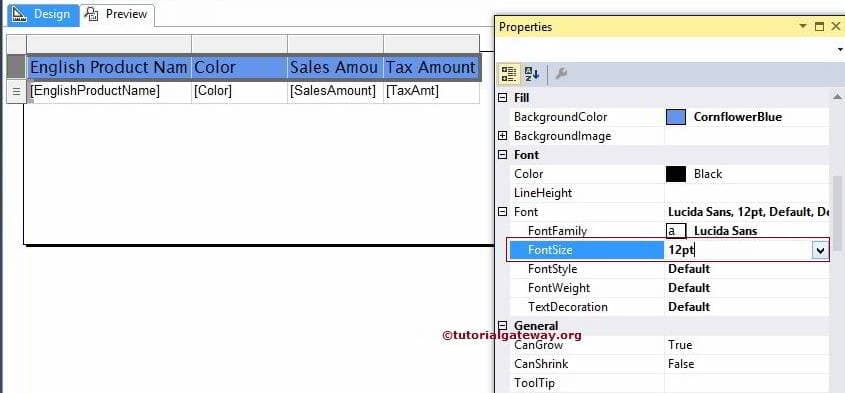
Font Size
To change the Font Size, Goto FontSize Property and change the font size as per your requirement. Here we are changing it to 12pt
Format Fonts and Background of a Textbox in SSRS 5
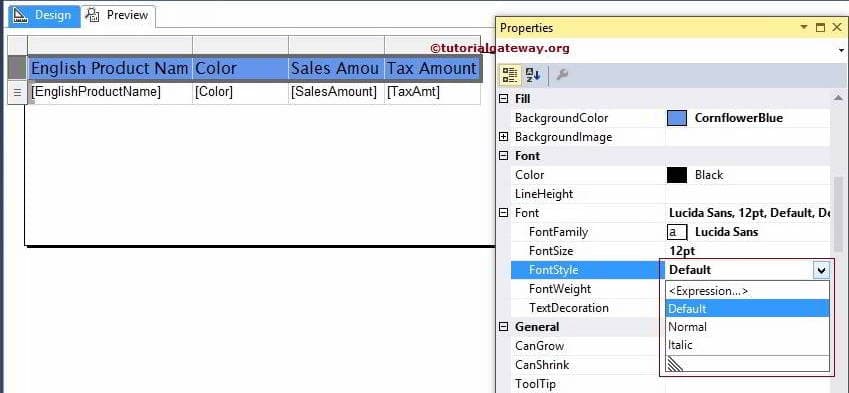
Font Style
To change the Font Style, Goto FontStyle Property and change the font style as per your requirement (Normal, Italic). Here we are are leaving the Default
Format Fonts and Background of a Textbox in SSRS 6
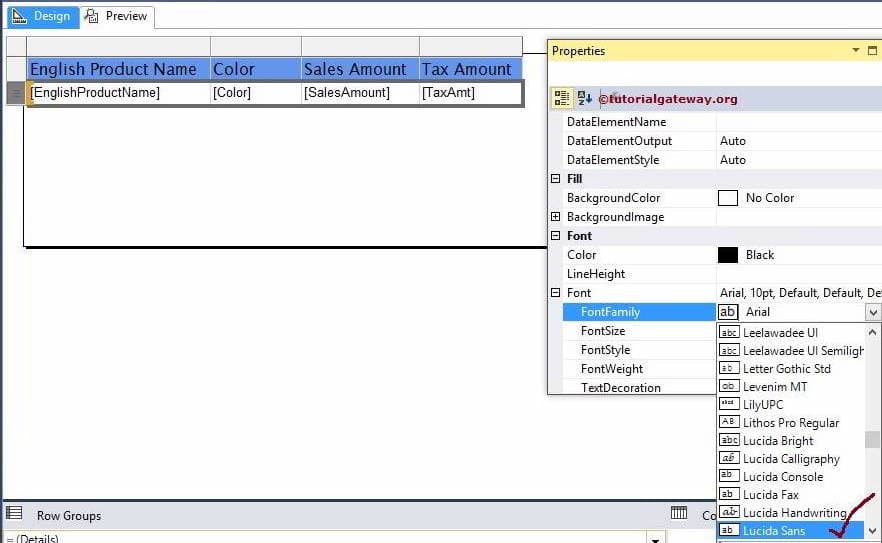
Font Family
To change the Font Family, Goto FontFamily Property and change the font as per your requirement. Here we are changing the Font of a Header Text and Details Row to Lucida Sans. 
Format Fonts and Background of a Textbox in SSRS 7
Let us preview the report
Format Fonts and Background of a Textbox in SSRS 8
If you observe the above screenshot, It looks neat and good
Thank You for Visiting Our Blog

Format Numbers in SSRS 2014


In this article we will show you, How to Format the Numeric values or Numbers present in a Text box in SQL Server Reporting Services 2014 with example.
To explain the available Numeric Format options, We are going to use below shown report. Please refer SSRS Table Report article to understand the Data Source and Dataset we used for this report. If you observe the below screenshot, It was a normal report with Product Name, Color, Sales Amount and Tax Amount columns.
Format Numbers in SSRS 2014
If you observe the above screenshot, The numeric values present in Sales Amount and Tax Amount columns are not attractive to impress the end-user (Too many numbers after decimal and no currency symbol etc).

Formatting Numbers in SSRS 2014

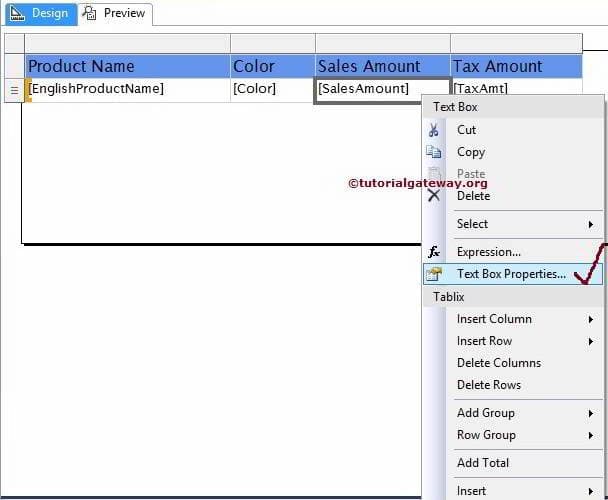
Select the Textbox containing Numeric values. In this example, Select Sales Amount Textbox of the SSRS report and Right click on it will open the context menu. Please select the Text Box Properties.. option from it
Format Numbers in SSRS 1
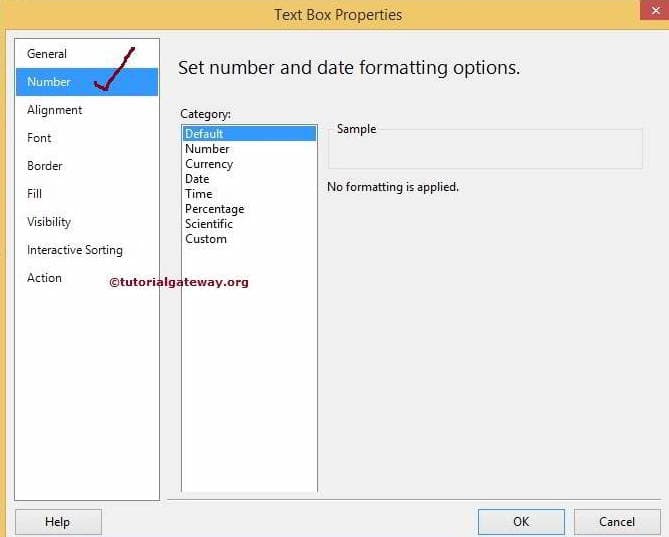
Once we click on the Text Box Properties.. option, a new Text box Properties window will be opened. Please select the Number tab as shown in below screenshot.
Format Numbers in SSRS 2
Format Number
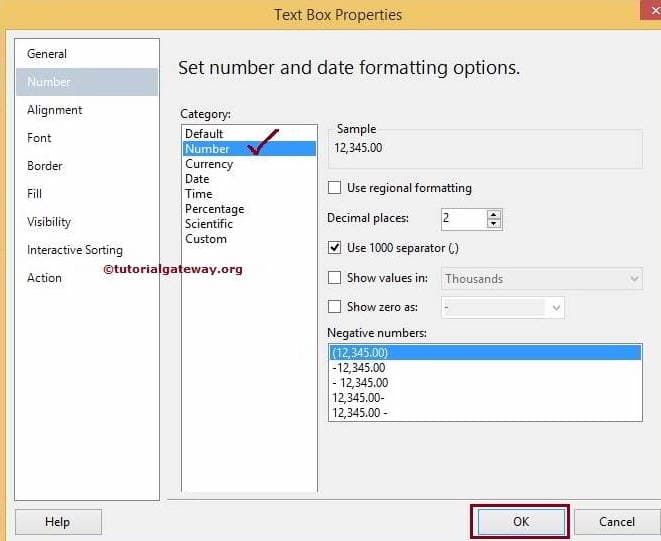
Please select the Numbers Category from the available list.
  • To remove the extra numbers from decimal place, Select the Decimal Place property and change the value to 2 as shown in below screenshot.
  • Use 1000 separator(,): If you want to separate the  1000 with comma then Select this option
Format Numbers in SSRS 4
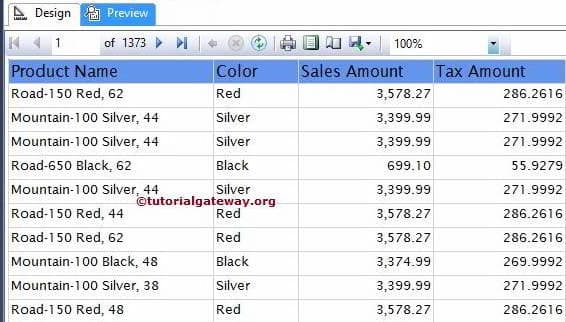
Click ok to finish Formatting the Numeric value of Sales Amount text box. Let us preview the report
Format Numbers in SSRS 5
Now, let us format the Numeric values in Tax Amount
Currency Format
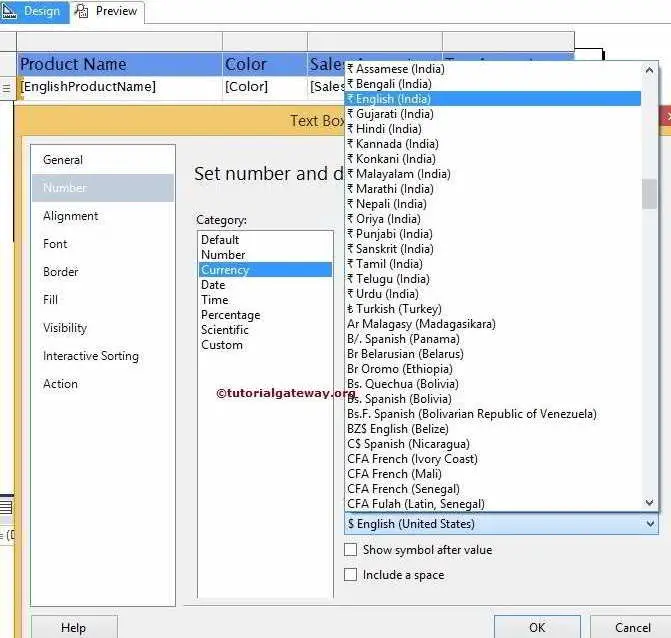
Please select the Currency Category from the available list. To change the currency, Please select the required currency from the provided list
Format Numbers in SSRS 6
We selected the United States Dollar for this example
Format Numbers in SSRS 7
Click ok to finish Formatting the numbers in Sales Amount and Tax Amount columns. Let us see the preview
Format Numbers in SSRS 8
If you observe the above screenshot, Numeric data in Sales Amount and Tax Amount columns looks attractive and more meaningful
Thank You for Visiting Our Blog

Thursday, October 1, 2015

Filters at Dataset Level in SSRS 2014


In SQL Server Reporting Services, Filters are similar to SQL WHERE Clause. Filters is used to restrict the Records displayed by the SSRS Reports. SSRS supports two types of Filters: Filters at Tablix Level and Filters at Dataset Level.
In this article we will show you, How to filter the data at Dataset Level in SQL Server Reporting Services 2014 with example.
TIP: If you want to apply the filters on multiple reports then, you can apply filters at shared dataset. It will be applicable to all the tables using that Dataset.
We are going to use below shown report to explain, filtering the data at Dataset level. Please refer SSRS Table Report article to understand the Data Source and Dataset we used for this report. If you observe the below screenshot, It was a normal report with Product Name, Color, Sales Amount and Tax Amount columns.
Filtering data at Dataset Level in SSRS 2014
If you observe the above screenshot, it is displaying the 1373 pages of data.

Filtering data at Dataset Level in SSRS 2014

Select the Dataset from the Report data tab of the report and Right click on it will open the context menu. Please select the Dataset Properties.. option from it
Filtering data at Dataset Level in SSRS 2014 1
Once we click on the Dataset Properties.. option, a new Dataset Properties window will be opened. Please select the Filters tab as shown in below screenshot.
Filtering data at Dataset Level in SSRS 2014 2
Click on the Add button will display the below properties
  • Expression: It will allow you to select the available Column from the Dataset or we can create our own Expression by clicking the fx button
  • Data Type: By default Text is selected as Data type. You can change as per your requirement. 
  • Operator: Please select the operator you want to use (Like, <, <= etc)
  • Value: Please specify the value you want to check against the Expression. Please click on the fx button to write value Expression.
In this example, We are going to display the records whose [Color] is Black so, Please select the [Color] as Expression and Operator as Like and Value as Black.
Filtering data at Dataset Level in SSRS 2014 3
Click Ok button to finish configuring Filters at Dataset Level. Let us Preview the Report
Filtering data at Dataset Level in SSRS 2014 4
If you observe the above screenshot, it is displaying the 224 pages of data because remaining data is not satisfying the Filter Condition (their color is not Black).
Let us add one more filter at Dataset level, for better understanding. Here, We are going to display the records whose [Sales Amount] is between 600 and 1000 so, Please select the [Sales Amount] as Expression and Operator as Between and Value as 600 and 1000.
Filtering data at Dataset Level in SSRS 2014 5
Here [Sales Amount] is Float value so, We have to convert both 600 and 1000 to Decimal value. If you know the conversion function you can directly write it. If not, Please click on the fx button and use the built-in functions
TIP: If you want to delete the unnecessary filter, Please select the Filter and click on theDelete button.
Click Ok button to finish configuring Filters at Dataset Level. Let us Preview the Report
Filtering data at Dataset Level in SSRS 2014 6
If you observe the above screenshot, it is displaying the 10 pages of data because remaining data is not satisfying the 2 Filter Conditions.
Thank You for Visiting Our Blog