Wednesday, September 2, 2015

SSAS - Named query in DSV

Named query in DSV is important in helping the developer to add only required field from the multiple tables. It is very similar to the views in database. There may be scenario where few fields required out of n number of fields from multiple tables for e.g. Only three fields are important for product sales and profitability analysis such as product name, product sub category and product category but these are spread across three tables called Product , productSubCcategory and productCategory along with so many unwanted fields (Refer the database AdventureWorksDW2008). Here we can make use of named query instead of referring these tables directly in DSV which improves the performance as well.


I would like to give steps required to create named query in DSV in this post.

Step 1: Create new DSV with FactInternetSales as main table and pull all the related tables to it and name it as InternetSales.
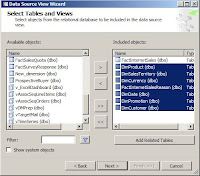
Fig 1


Step 2: Right click on DimProduct dimension and select the option NamedQuery from Replace table option
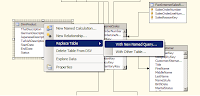
Fig 2


Step 3: Provide the below query in the query window of the NamedQuery

select a.ProductKey,a.EnglishProductName,
b.ProductSubcategoryKey,EnglishProductSubcategoryName ,
c.ProductCategoryKey,EnglishProductCategoryName
from dimProduct a
join DimProductSubcategory b on a.ProductSubcategoryKey = b.ProductSubcategoryKey
inner join DimProductCategory c on b.ProductCategoryKey = c.ProductCategoryKey
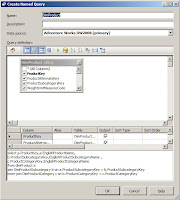

Fig 3


Now you can see that product table is replaced with fields from this query and by default it considered productkey as primary key which is having unique values among the fields selected.
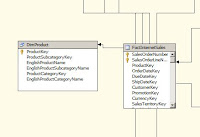
Fig 4


We can see importance of hierarchy and attribute relationship in my next blog.

Create a Data Source View in SSAS

In this article, I will show you how to create a data source view in SSAS.

Before starting this, let’s have a look on What is Data Source View in SSAS?
A data source view contains the logical model of the schema which is used by Analysis Services multidimensional database objects — namely cubes, dimensions, and mining structures. A data source view is the metadata definition, stored in an XML format.
A Data Source View:
  • Contains the metadata that represents selected objects from one or more underlying data sources, or the metadata that will be used to generate an underlying relational data store
  • Can be built over one or more data sources, letting you define multidimensional and data mining objects that integrate data from multiple sources.
  • Can contain relationships, primary keys, object names, calculated columns, and queries that are not present in an underlying data source and which exist separate from the underlying data sources.
  • Is not visible to or available to be queried by client applications.
1. First of all open Visual Studio 2010 and open any SSAS project.
2. In solution explorer, right click on Data Source Views and select New Data Source View.
2-Create a Data Source View in SSAS
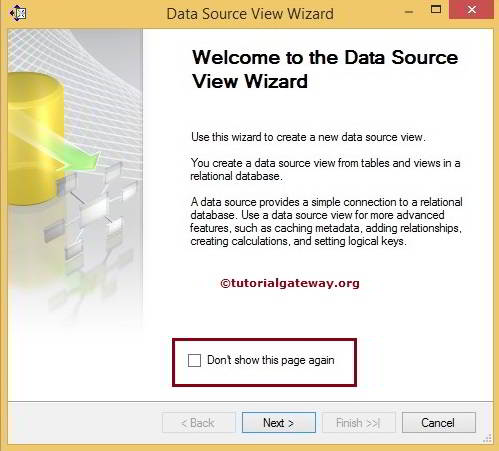
3. A Data Source View Wizard window opens. In that check Don’t show this page again and click on Next button.
3-Create a Data Source View in SSAS
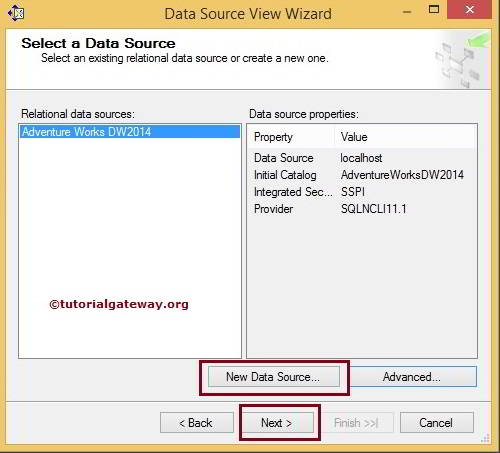
4. In next step, select existing data source if your already created it otherwise create New Data Source. Here we select existing Data Source. Then click on Next Button.
4-Create a Data Source View in SSAS
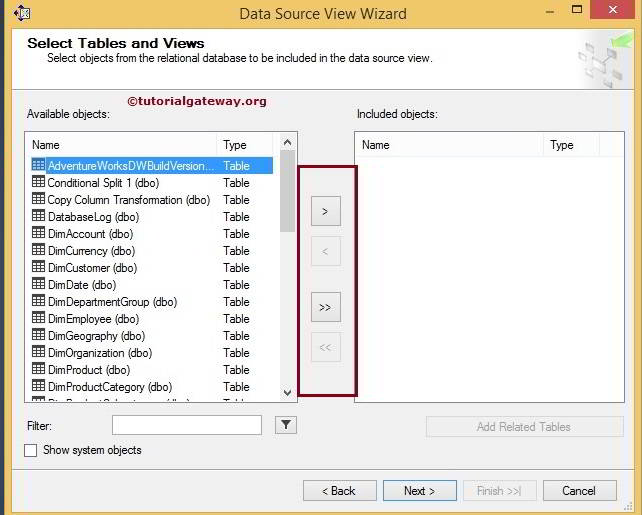
5. Now Select Tables And Views page appears. It will shows lists of Available Objects and Included Objects. Now Double-Click on DimAccount to add it to the Included Objects list.
Now Select Tables and Views page should look like the following:
5-Create a Data Source View in SSAS
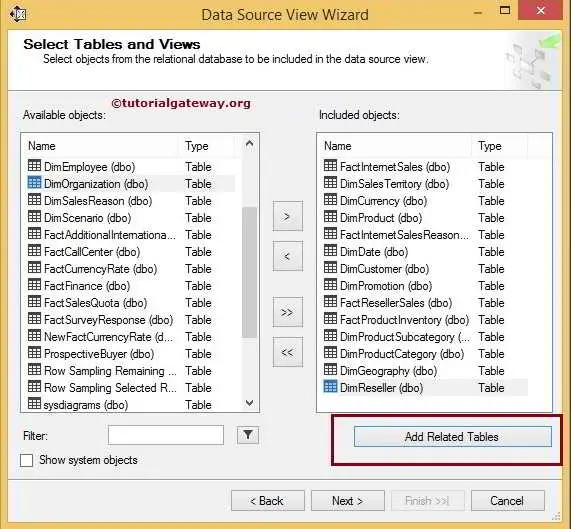
6. Now Select the DimAccount table and then click on Add Related Tables.
It will analyzes the foreign key relationships in the source database and adds theFactFinance table in to the Included Objects list. It is the only table related toDimAccount. Now Select Tables and Views page should look like the following:
6-Create a Data Source View in SSAS
7. In the Filter box, type dim and click the filter button. It will filter the Available Objects list to find the tables easier. After that click on >> button to add all tables into Included Objects.
7-Create a Data Source View in SSAS
8. Similarly type fact into filter box and the click on filter button. After that click on >> button to add all tables into Included Objects. Now your page should look like following.
8-Create a Data Source View in SSAS
Then click on Next button.
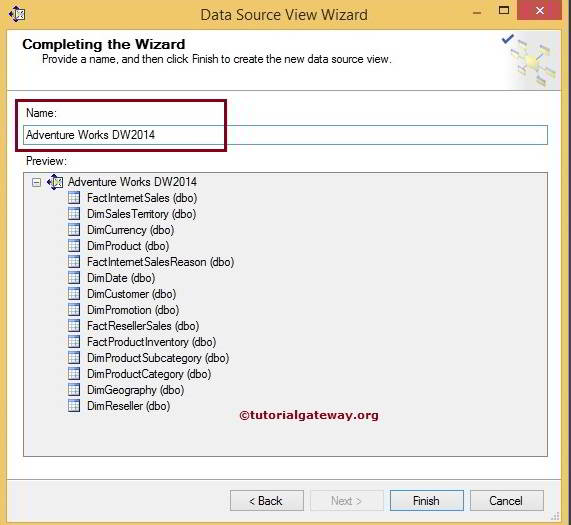
9. In next step, you will see the summary of Data Source View. Also give name of data source view. Here we give AdventureWorksDW2012 as name.
9-Create a Data Source View in SSAS
Then click on Finish Button.
10. Now your data source view design should look like following screen shot :
10-Create a Data Source View in SSAS
So we have done with Data Source View in SSAS.
If your data source view contains too many tables, you will not be able to see all the tables in the diagram pane. Following steps shows you how to browse the contents of a data source view.
  • Click and hold the four-headed arrow button at the lower-right corner of the data source view in diagram pane. The table locator looks like the following screen shot.
11-Create a Data Source View in SSAS
  • Now drag your mouse around the table locator. The diagram pane scrolls to match your movements.
  • Otherwise click a table name in the Tables pane. The diagram pane scrolls so that it is centered on the table you selected.
Note: Microsoft Books online is a default reference of all articles.


SSAS Data Source View


A Data Source View in SSAS is a set of tables or views from the data base that are required to design the cube (We can simply called this as data set). Analysis services can only access the tables or views inside the Data Source View, anything outside the Data Source View is not accessible. Some important properties of analysis services data source view are:
  • One data source view can pull data from only one data source.
  • Analysis services allows us to create multiple data source views from single data source.
  • Analysis services allows us to create data source views from multiple data source.
  • Any changes made in the Data Source View such as changing table names, removing few unwanted columns will not reflect the underlying database.
For example, If the data warehouse contains 100 tables and we want only 20 tables to design the cube then there is no point in adding 100 tables. Instead of that, data source view provides space to add those 20 tables.
TIP: One data source view can pull data from only one data source.
NOTE: Any changes made in the Data Source View such as changing table names, removing few unwanted columns will not reflect the underlying database.

Creating Data Source View in SSAS

To create data source View, Right click on the Data Source View folder present in the solution explorer and select the New Data Source View option from the context menu
SSAS Data Source View 1
It will open the Data source view wizard with the welcome page. If you don’t want to see this welcome page again check mark the Don’t show this page again option below.
SSAS Data Source View 2
Click Next
SSAS Data Source View 3
If you already created data source then it will be displayed like above or you have to click on New data Source button to create new one. Please refer SSAS Data Source article to understand how to create data source. For this example, Let me select the existing one.
To add data in DSV we have to select the required tables from Available Objects to Included Objects
For adding, select the required tables in Available Objects and click on > button. This will add those tables to included objects
For deleting the unwanted tables from Included Objects, select the table and click on <button from the below GUI form.
<< and >> buttons are used to add or remove all the tables from Included Objects.
SSAS Data Source View 4
There is one more button called Add related Tables. If we select one table in Included Objects and want to add all the tables which are related to that table using primary and foreign key relationship then this button do the trick for you.
SSAS Data Source View 5
Here I am selecting some random tables
Click next
SSAS Data Source View 6
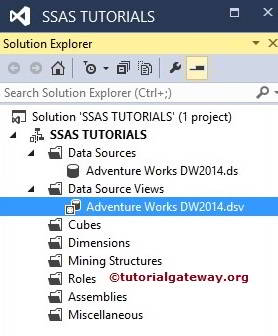
Click finish and see the newly created data source view in the solution explorer
SSAS Data Source View 7
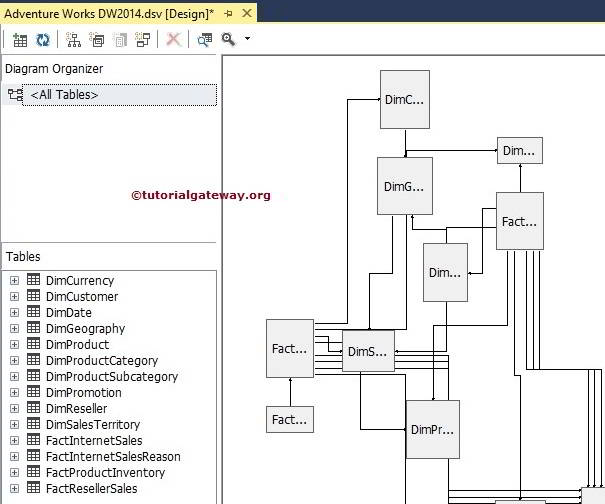
Double click on the newly created data source view will shows the selected tables, views and the relationships as shown in the below figure.
SSAS Data Source View 8
Thank you for Visiting Our Blog

Data Source (SSAS Multidimensional)

In an Analysis Services multidimensional model, a data source object represents a connection to the data source (Database or Data warehouse) from which you are processing (or importing (Or load)) data. A multidimensional model must contain at least one data source object, If we have the situations, where we have to use multiple databases then we use multiple data sources. In general, Most of the times we may work with 1 or 2 data sources.

Data Source in SSAS contains the connection information and it is the combination of Provider, Server Name, Database Name and Impersonation Information.


Choose a Data Provider:

SSAS Supports both Microsoft .NET Framework or native OLE DB provider. The recommended data provider for SQL Server data sources is SQL Server Native Client because it typically offers better performance. 

The default provider for a new connection is the Native OLE DB\SQL Server Native Client provider. This provider is used to connect to a SQL Server Database Engine instance using OLE DB.

Following are some of the major data sources supported by SSAS: SQL Server, MS Access, Oracle, Teradata, IBM DB2, and other relational databases with the appropriate OLE DB provider.


Server Name:


Server Name is the network name of the Database Engine instance. It can be specified as the IP address, the NETBIOS name of the computer, or a fully qualified domain name. If the server is installed as a named instance, you must include the instance name (for example, <computername>\<instancename>).

Log on to the Server specifies how the connection will be authentication. Use Windows Authentication uses Windows authentication. Use SQL Server Authentication specifies a database user login for a Windows Azure SQL databases or a SQL Server instance that supports mixed mode authentication.

Connection Manager includes a Save my password checkbox for connections that use SQL Server authentication. Although the checkbox is always visible, it is not always used.


Database Name:


Select or enter a database name or Attach a database file are used to specify the database.

In the left side of the dialog box, click All to view additional settings for this connection, including all default settings for this provider. Change settings as appropriate for your environment and then click OK.

The new connection appears in the Data Connection pane of the Select how to define the connection page of the Data Source Wizard.


Impersonation Information:

When we design a cube in which data source is using windows authentication then it will be executed as current user. But, when you deploy the database to the server there will be no current user. In this case when a user requests AS to process an object it needs to know under what security context to connect to the data source. Essentially you need to get the AS service to impersonate another user in order to retrieve data from an external source on a user’s behalf.
Impersonation allows SSAS to assume the identity/security context of the client application which is used by SSAS to perform the server side data operations like data access, processing etc. As part of impersonation, the following options are available in SSAS:
Use a specific Windows user name and password: This option lets you to specify Windows account credentials which will be used by SSAS to perform operations like source data access, processing etc.
Use the service account: When this option is selected, SSAS uses the credentials of the service account under which the Analysis Services service is configured/running for source data access, processing etc.

Use the credentials of the current user: When this option is set, SSAS uses the credentials of the current user for performing operations like DMX Open Queries, Local cubes etc. This option cannot be used for performing server side operations like source data access, processing etc.

Inherit: This option let's the SSAS server decide which impersonation mode is suitable for each type of operation. When this option is set, by default SSAS will use the service account for operations like processing and the credentials of the current user for operations like Local cubes, querying the data mining models, etc...


View or Edit Connection Properties

To edit the connection string

1. In SQL Server Data Tools, double-click the data source object in Solution Explorer.

2. Click Edit, and then click All on the left navigation pane.

3. The property grid appears, showing available properties of the data provider you are using. 


Creating Data Source in SSAS

After creating the New multidimensional project (Analysis Services project), the solution explorer looks like below


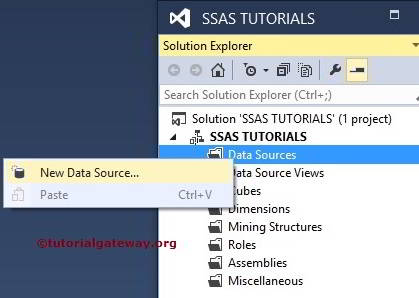
To create data source, Right click on the Data Sources folder present in the solution explorer and select the New Data Source option from the context menu


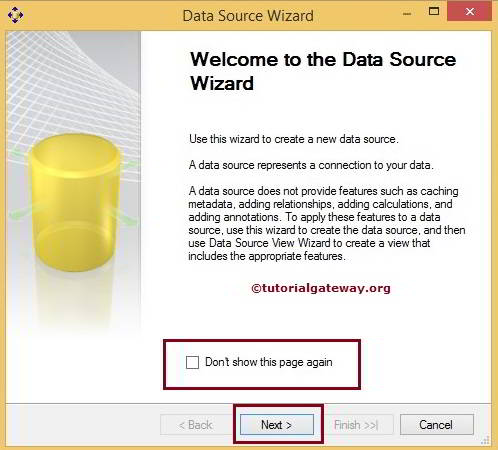
It will open the Data source wizard with the welcome page. If you don’t want to see this welcome page again check mark the option Don’t show this page again below.


Click Next


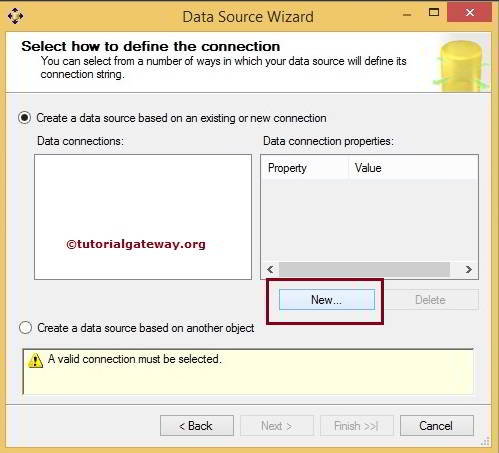
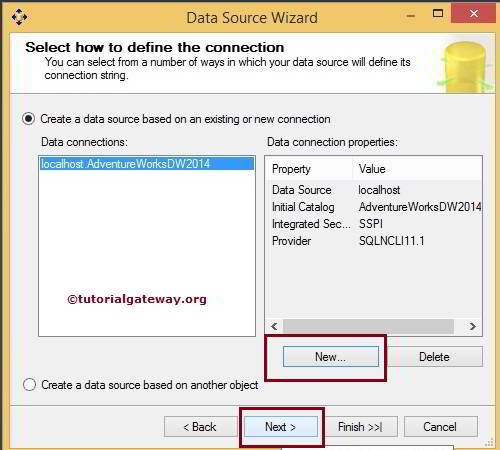
If you observe the above, Data Connections pane is empty because we have no connection managers before. If we created any connection managers before then instead of creating them again and again we can select them here.

Click on the new button from the above screenshot will open another window form of Connection Manager to select the Provider, Server Name and Database Name.


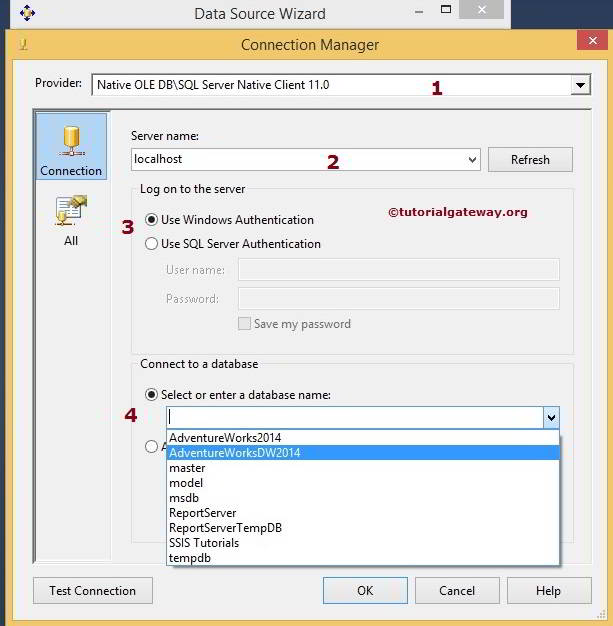
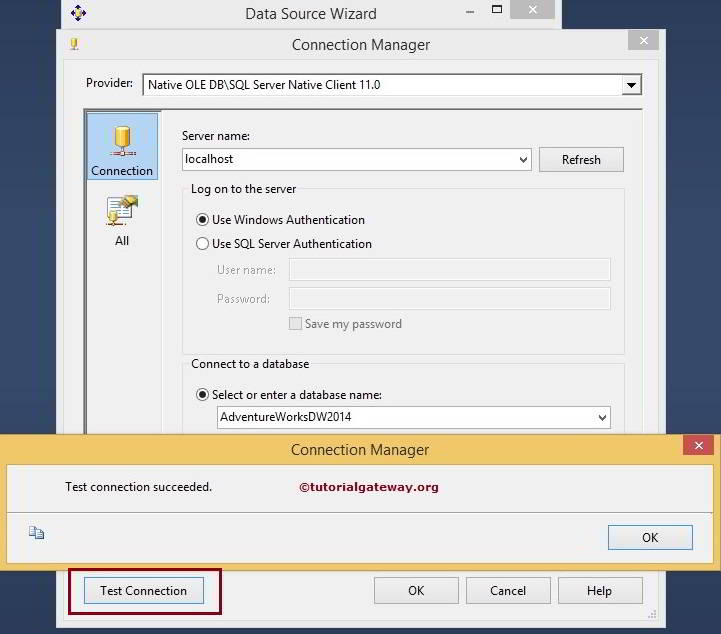
From the above screenshot, you can observe that we are using our localhost windows account as server name and [AdventureWorksDW2014] as the database name.

NOTE: Here we are working with local database so we are using windows credentials but in real time, you have to select the SQl Server authentication and provide the credentials given by the database admin people or your team leader.

Click on the Test Connection button provided below to check whether the connection is successful or not.


Click ok


Click Next to configure Impersonation settings 

Impersonation Options Available in SSAS:


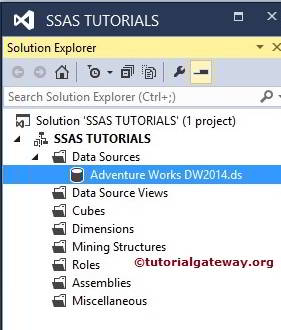
Click on finish button and check the solution explorer for newly created data source


Create a Data Source in SSAS


In this article, I will show you how to Create a Data Source in SSAS.
Before starting this,Download AdventureWorksDW2012 database from below link:
After completion of download, attach that database into your SQL Server 2012.
1. Now open Visual Studio 2010.
2. Then go to File –>  New –> Project.
2-Create a Data Source in SSAS
3. A New Project Window opens. In that select Business Intelligence fromInstalled Templates. Then select Analysis Services Multidimensional and Data Mining Project.Also give Name of project i.e. StartSSAS.
3-Create a Data Source in SSAS
Then click on OK button.
4. Now your Project’s Solution Explorer looks like below:
4-Create a Data Source in SSAS
5. Now right click on Data Sources and Select New Data Source.
5-Create a Data Source in SSAS
6. A Data Source Wizard opens, In that select checkbox of Don’t show this page again. Then click on Next Button.
6-Create a Data Source in SSAS
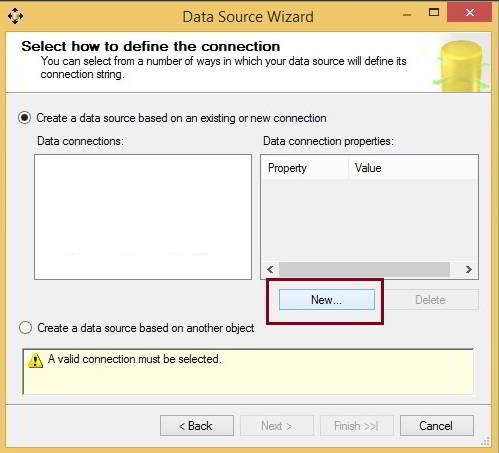
7. In next step, click on New Button.
7-Create a Data Source in SSAS
8. A Connection Manager dialog-box opens. In that Enter the Server Name and provide necessary credentials. Then select AdventureWorksDW2012 Database.
8-Create a Data Source in SSAS
Then click on OK button.
9. Now you will see screen like below.
9-Create a Data Source in SSAS
Now click on Next Button.
10. In next step, Impersonation Information page appears. On this page, you can configure the Windows security credentials.
  • Use A Specific Windows User name and Password option lets you enter user name & password of a Windows user account.
  • Use The Service Account option will have Analysis Services use its service logon user ID to connect to the data source.
  • Use The Credentials Of The Current User option is only used for some specialized circumstances. It is important to note that when you use this option, Analysis Services will not use the Windows user name and password of the current user for most processing and query tasks.
  • Inherit option causes this data source to use the impersonation information contained in the Analysis ServicesDataSourceImpersonationInfo database property.
The most commonly selected options are Use the service account or Use a specific windows user name and password.
10-Create a Data Source in SSAS
Here we select Use the service Account option and then click on Next button.
11. Leave AdventureWorksDW2012 as the data source name and click Finishto complete the wizard.
11-Create a Data Source in SSAS
12. Now you will see newly created data source in your Solution Explorer.
12-Create a Data Source in SSAS
Congratulations! We successfully created Data Source in SSAS.

************************** End of the Document***********************************

Unified Dimensional Model in SSAS

UDM (Unified Dimensional Model)


             The UDM is central to your Analysis Services database architecture.UDM is your friend because it helps you narrow the gap between end users and data they need. Analysis Services provides you with features that help you design a model that will serve the needs of end users. It provides you with a way to bring data from multiple heterogeneous sources into single model.

              Pre-UDM versions of Analysis Services only supported one fact table per cube. Therefore, only one data source could be used for specifying the fact table of cube.


Figure: The UDM provides a bridge between end users and their data

                  The above figure shows the architecture of the Unified Dimensional Model that is implemented in Analysis Services. It helps you to integrate data from various data sources such as Oracle, Sql Server, DB2 and TeraData into a single model that merges the underlying schemas into a single schema.To restrict end user view by using concept Perspectives in Analysis Services.
                  In OLAP, the data analyzed by end users is often historical data that might be a few days, months, or even year old. XML for Analysis (XMLA) standard, which allows client tools to retrieve data from Analysis Services. To write OLAP queries retrieve data within a few seconds.

The UDM consists of several components as follows
    • Data source – It represents a connection to the database where the data is stored.
    • Data source view (DSV) - Abstracts the underlying database schema. Although a DSV might seen redundant, it can be very useful by letting you augment the schema.
    • Dimensional Model – After you’ve created a DSV, the next step is to build the dimensional model.

Key elements of the UDM are as follows:
    • Heterogeneous data access support: UDM helps you to integrate and encapsulate data from heterogeneous data sources. It helps you combine various schemas into a single model.
    • Real time data access with high performance: The UDM provides end users with real time data access.     The UDM creates a MOLAP cache of underlying data. It helps in providing real time data access with     the speed of an OLAP database due to MOLAP cache.
    • Rich metadata, ease of use for exploration, and navigation of Data: UDM provides a consolidated view of the underlying data sources with the richness of metadata provided by the OLAP world. End users are able to exploit this Meta data to navigate and explore data in support of marking business decisions.
    • Rich analytics support: UDM provides rich analytics such as Key performance Indicators and Actions that help in understanding your business with ease and automatically take appropriate actions based on changes in data by using MDX (Multidimensional expressions) language.
    • Model for Reporting and Analysis: It provides you with the capability of not only querying the aggregated data that are typically used for analysis, but also has the ability to provide for detailed reporting up to the transaction level across multiple heterogeneous data sources.


Additional Features in Analysis services 2008:
    • In Analysis services 2008, the UDM is tightly integrated with data mining features. You can also create a data mining dimension from data mining model.


      • Several MDX functions are also added in Analysis services 2008.
      • In a dimension that can have hundreds of attributes. But in real time attributes with in dimension are not used in many queries. Only a subset of the attributes might be heavily used. Including unnecessary attributes and hierarchies in your UDM cases performance decreases in some cases.
             The Analysis Services 2008 design tools also allow you to better visualize the relationships between the attributes that you need and help you build a better dimension model. (It’s known as Fine Tuning Dimensions.)

             Merge UDM in Analysis Services 2008 is become a powerful, enterprise class product that you can use to build large scale OLAP databases and implement strategic business analysis applications against those databases.

             Finally you learn about the overall architecture of Analysis Services 2008 followed by the concept of the unified Dimensional Model (UDM), it helps you to have a unified view of your entire Datawarehouse.

What is SQL Server Analysis Services (SSAS)?

Tuesday, September 1, 2015

What is the difference between OLAP and OLTP ?


OLTP (On-line Transaction Processing) is characterized by a large number of short on-line transactions (INSERT, UPDATE, DELETE). The main emphasis for OLTP systems is put on very fast query processing, maintaining data integrity in multi-access environments and an effectiveness measured by number of transactions per second. In OLTP database there is detailed and current data, and schema used to store transactional databases is the entity model (usually3NF). Example: In a banking System, you withdraw amount through an ATM. Then account Number,ATM PIN Number,Amount  you are withdrawing, Balance amount in account etc are operational data elements.

OLAP (On-line Analytical Processing) is characterized by relatively low volume of transactions. Queries are often very complex and involve aggregations. For OLAP systems a response time is an effectiveness measure. OLAP applications are widely used by Data Mining techniques. In OLAP database there is aggregated, historical data, stored in multi-dimensional schemas (usually star schema). Example: If we collect last 10 years data about flight reservation, The data can give us many meaningful information such as the trends in reservation. This may give useful information like peak time of travel, what kinds of people are traveling in various classes (Economy/Business)etc.


Online Transaction Processing (OLTP)
Online Analytical Processing (OLAP)
Designed to support Daily DML Operations of your application.
Designed to hold historical data for analyses and forecast business needs.
Holds daily Latest Transactional Data related to your application.
Data is consistent up to the last update that occurred in your Cube.
Data stored in normalized format.
Data stored in denormalized format.
Databases size is usually around 100 MB to 100 GB.
Databases size is usually around 100 GB to a few TB.
Used by normal users.
Used by users who are associated with the decision making process, e.g., Managers, CEO.
CPU, RAM, HDD space requirement is less.
CPU, RAM, HDD space requirement is higher.
Query response may be slower if the amount of data is very large,it can impact the reporting performance.
Query Response is quicker, management can do Trend analysis on their data easily and generate quicker reports.
T-SQL language used for query.
MDX is used for querying on OLAP Cube.
Backup religiously; operational data is critical to run the business, data loss is likely to entail significant monetary loss and legal liability.
Instead of regular backups, some environments may consider simply reloading the OLTP data as a recovery method.