Wednesday, October 7, 2015

SSRS - How to implement Document Map in the report

1.     Background

The purpose of this article is to describe a way of implementing document map in the report.

2.     What is Document Map?

·          Document Map is an object that works likes a book index that helps us to find a particular topic in the book. Same way, Document Map provides navigational links to report items in a rendered report.
·         We can see Document Map in the separate side pane next to the report.
·         A user can click links in the document map to jump to the report page that displays that item.
·         Once we click on any item in the Document Map, It refreshes the report and displays the area of the report that corresponds to the item in the document map.
·         Document Map is very useful when we have a large report with some Groups and we can utilize any group for Document Map. In this way, Document Map contains all the Grouping items and based on that we can easily find their corresponding detail data also.
Fig. showing Document Map having Fiscal Years

3.     Step by Step procedure to implement Document Map in the report:

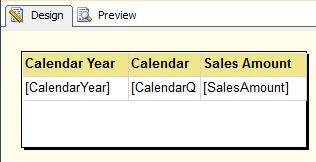
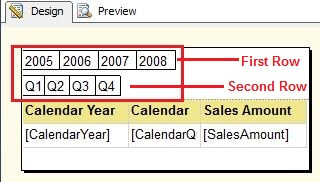
·         Below is the sample report in which we will implement Document Map. This report is having Page Break with Fiscal Year Group so Report will show data in each page for a particular year only :


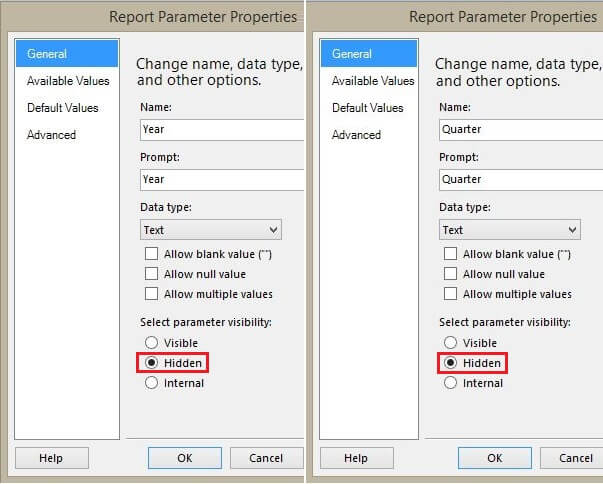
·         For creating the Document Map, go to the Row Grouping in Grouping Pane then click on Fiscal Year Group and go to the grouping properties: 

·         It will open the Group properties, Go to the Advance and Select Fiscal Year in the document.


Click ok.
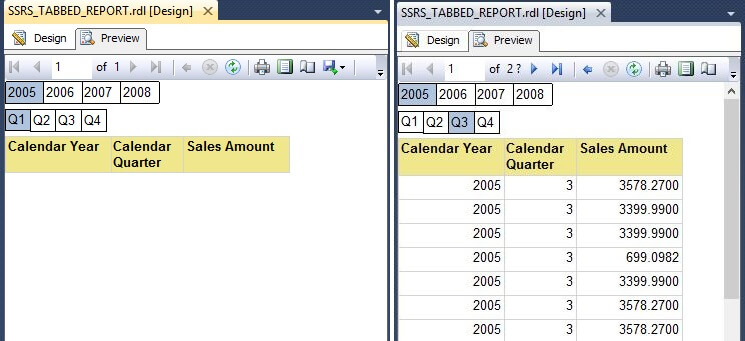
·         Now preview the report and see whether Document Map appears in the report sid area or not:


·         Now click on some Year (e.g.2010) and see whether report jumps to particular item or not.
·         Now click on some other Year (e.g 2008) and see whether report jumps to items that belongs to 2008 year:  
It means Document Map has been implemented successfully and working fine.

4.     Conclusion
By using the above steps, we can implement Document Map in the report.


SQL Circuit
----------------------------------------------------End of Article---------------------------------------------------


Document Map in SSRS 2014


SSRS Document Map Label

In SQL Server Reporting Services, Document Map property provides the navigation links in the report preview. User can use these links to navigate between multiple reports or between pages.

Document Map in SSRS Example

In this example we will show you, How to create or Enable Document Map Labels in SQL Server Reporting Services 2014 with example. For this, we are going to use the below shown report. Please refer the GROUPING IN SSRS Table Reports article to understand the Data Source and the grouping technique we used in this report.
Document Map in SSRS 2014
SQL Code we used inside the Embedded Dataset is:
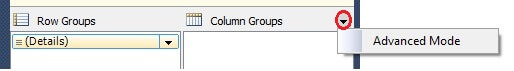
In reporting services, We can enable the Document Map in three ways:
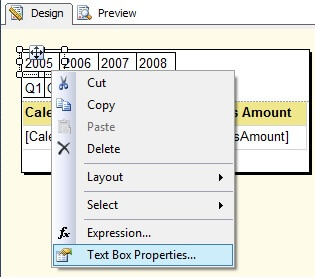
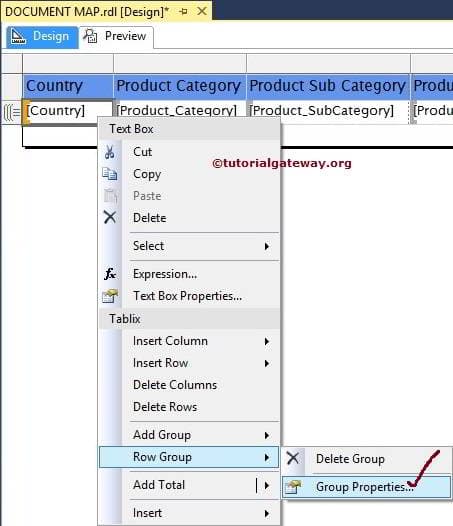
First, Select the column and Right click on the column to open the context menu. From the context menu, Please select the Row Group option and then select the Group Properties..option as shown below
Document Map in SSRS 2014
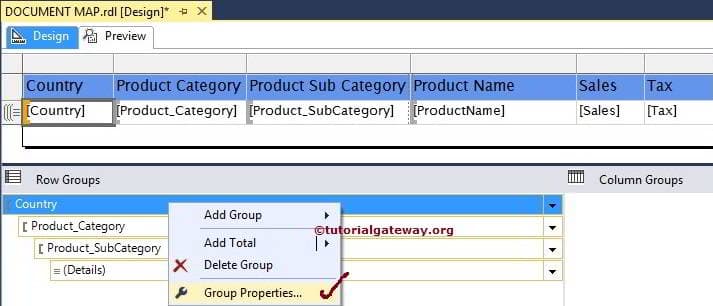
Second method, Go to Row Groups pane and right-click on the column name to open the context menu. From the context menu, Please select the Group Properties.. option as shown below
Document Map in SSRS 2014
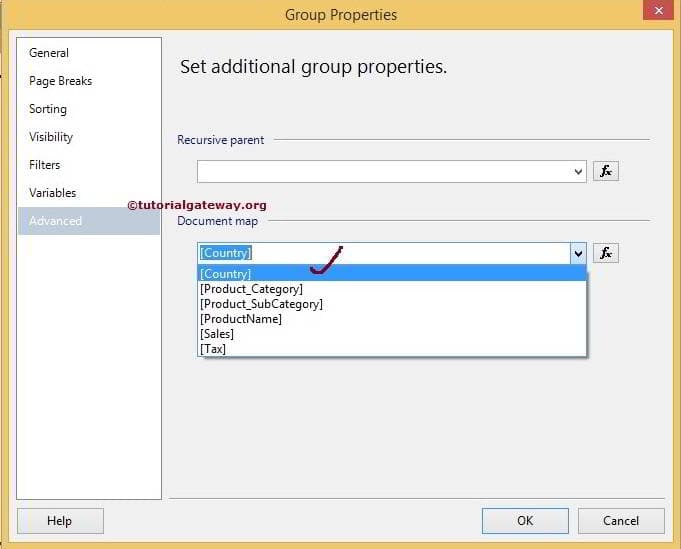
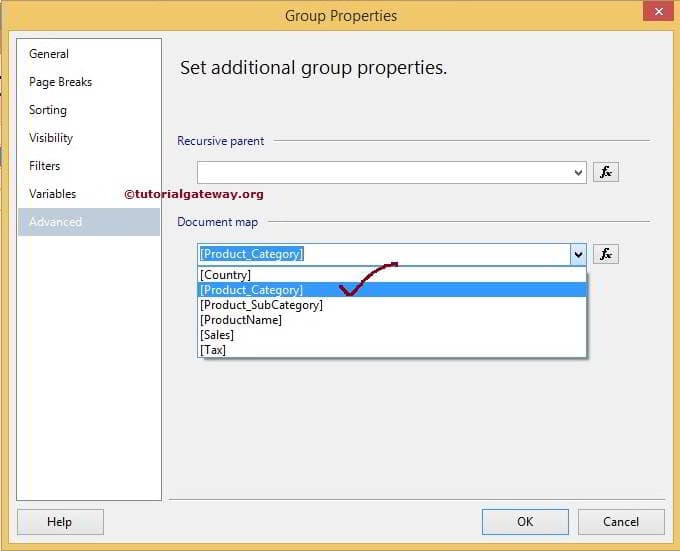
Once you selected the Group Properties.. option, a new window will be opened to configure the group properties.
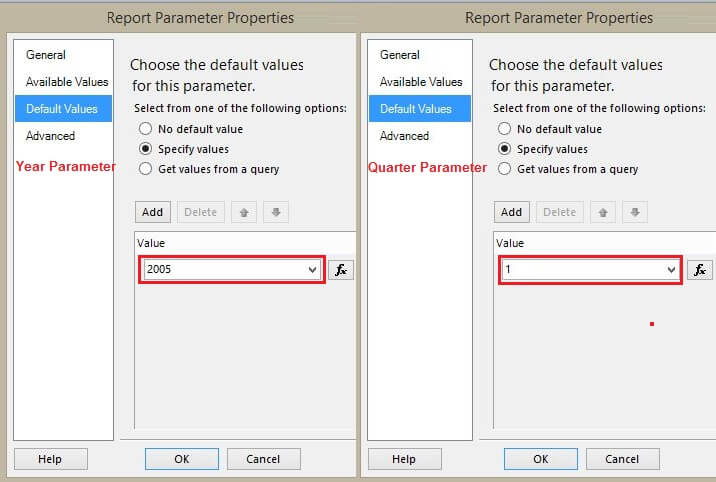
Please navigate to Advanced Tab and select the column name under the Document mapproperty as shown below. These column values will be displayed as Document map output
Document Map in SSRS 2014
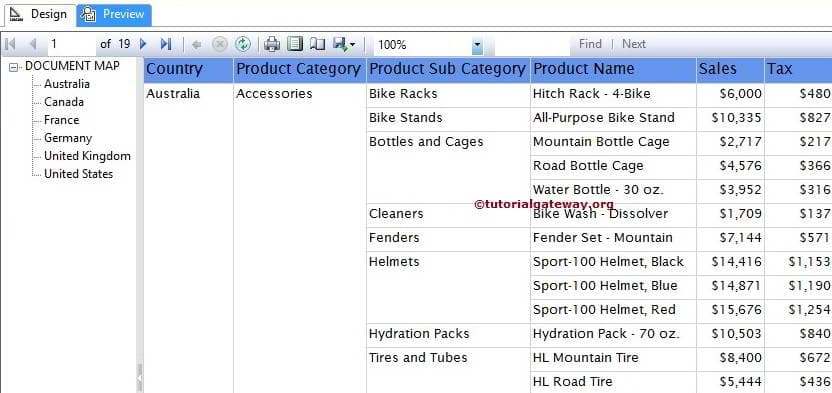
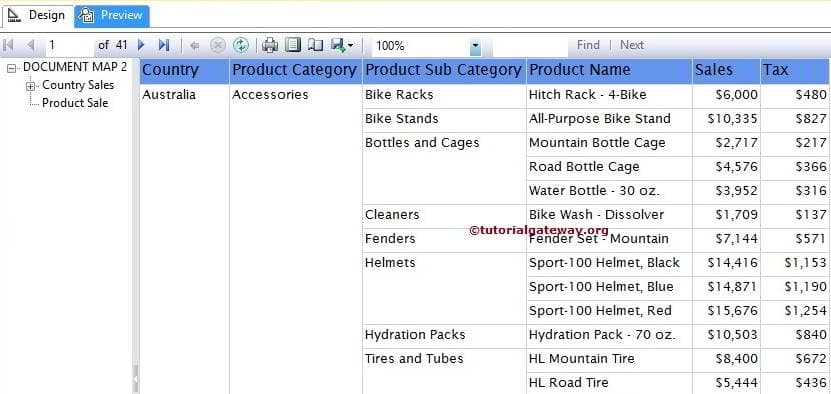
Click Ok to finish configuring the Document Map Label property. Let us click the preview button to see the report preview
Document Map in SSRS 2014
From the above screenshot you can observe that, SSRS reporting is displaying separate tab with countries list. If you click on any country name, report server will navigate to that country name. For instance, below screenshot is displaying the results of Germany country.
Document Map in SSRS 2014
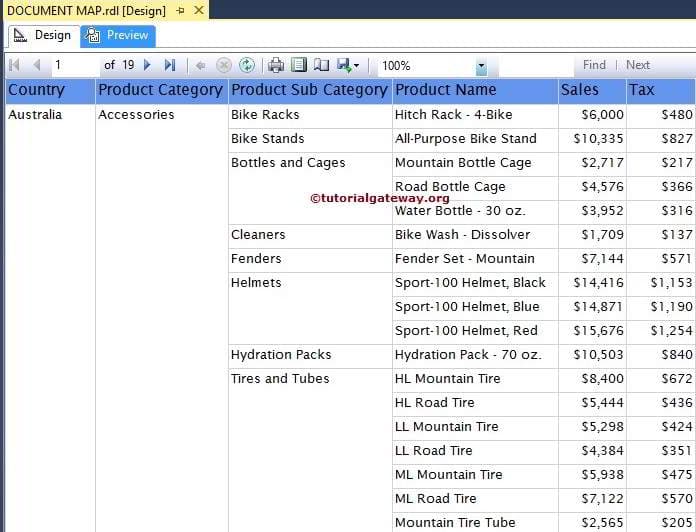
Though we added document map for countries list, we are unable to navigate this large report. Lets add Product Category to the document map label as well
Document Map in SSRS 2014
Now if you observe the below screenshot, you can see the better navigations. It looks like a PDF file with index on left side
Document Map in SSRS 2014
We used the above steps to Configure Document Map label property on previously created Subreports also.
Document Map in SSRS 2014

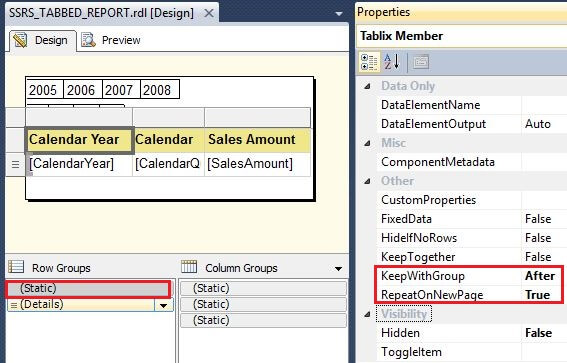
Document Map at Tablix level

In real-time, we may see multiple tables or multiple tablix will be embedded in single report. If this is the case, it will be very difficult to navigate between two tables. In these situations, we can use the Document Map Property at tablix level for better navigation.
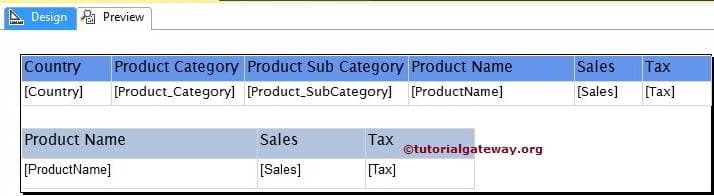
For better understanding, We will show you one example. If you observe the below screenshot, we added one more table to First example
Document Map in SSRS 2014
First, Select the first table and go to the Tablix properties. Within the properties pane, Please select the DocumentMapLabel property and assign Unique name to it. From the below screenshot you can observe that, We assigned Country Sale 
Document Map in SSRS 2014
Next, Select the second table and go to the Tablix properties. Within the properties pane, Please select the DocumentMapLabel property and assign Unique name to it. From the below screenshot you can observe that, We assigned Product Sale 
Document Map in SSRS 2014
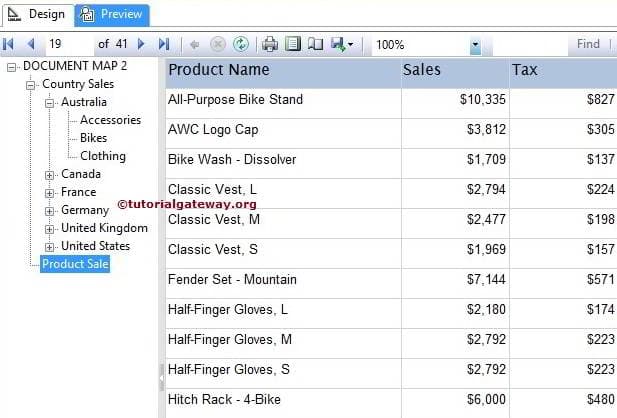
Click Preview tab to see the report Preview. If you observe the below screenshot, Report manager is displaying the Document map labels of two tables
Document Map in SSRS 2014
If you want to see the second table, Just click on Product Sale label as shown below
Document Map in SSRS 2014
Thank You for Visiting Our Blog

Creating a Tabbed Report in SSRS

Have you ever struggled with creating tabs for a SQL Server Reporting Services report? If yes, then you will most likely know that SQL Server Reporting Services does not provide any built in feature to accomplish this task. Finding a suitable solution can be very tricky. So how can we create a tabbed report in SSRS?


In this tip I will give a demo on how to create a tabbed report in SSRS? To demonstrate the solution, I will use the AdventureworksDW2008R2 sample database for SQL Server and SQL Server 2012 Reporting Service.
This tip assumes that you have previous real world work experience building a simple SSRS Report.

Problem
Have you ever struggled with creating tabs for a SQL Server Reporting Services report? If yes, then you will most likely know that SQL Server Reporting Services does not provide any built in feature to accomplish this task. Finding a suitable solution can be very tricky. So how can we create a tabbed report in SSRS?
Solution
In this tip I will give a demo on how to create a tabbed report in SSRS? To demonstrate the solution, I will use theAdventureworksDW2008R2 sample database for SQL Server and SQL Server 2012 Reporting Service.
This tip assumes that you have previous real world work experience building a simple SSRS Report.

Step 1: Create New SSRS Report

Let's create a sample report for demo purposes. Please change the report name to SSRS_TABBED_REPORT. You can refer to the below image.
Adding New Report

Step 2: Create SSRS Data Source and Dataset

I have already created a data source connection to the AdventureworksDW2008R2 sample database. Let's create the below dataset for this sample report.
Main Dataset: This dataset will be used for the report body and it has two query parameters @Year and @Quarter. This dataset returns three data fields CalendarYear, CalendarQuarter and SalesAmount.
SELECT     DimDate.CalendarYear, DimDate.CalendarQuarter, FactInternetSales.SalesAmount
FROM       DimDate INNER JOIN FactInternetSales ON DimDate.DateKey = FactInternetSales.OrderDateKey
WHERE      (DimDate.CalendarYear = @Year) AND (DimDate.CalendarQuarter = @Quarter)
ORDER BY   DimDate.CalendarYear, DimDate.CalendarQuarter
On successful creation, SQL Server Reporting Services will automatically create two report parameters Year andQuarter. After creating the Main dataset, the Report Data pane looks like the below image.
Report Data Pane Window

Step 3: SSRS Report Parameters Configuration

Please make the below changes for both the Year and Quarter report parameters.

Hide the parameters

Our sample report has two report parameters Year and Report. As you know we want to implement a tab navigational structure in SSRS, so we have to hide these two parameters. You must be thinking how will the parameter values be passed into the query? Actually we have to create tabs for each parameter and its value; each tab will have one parameter value assigned.
When a user clicks on a particular tab the corresponding parameter value will be passed into the query i.e. suppose you have a year parameter which has two values 2005 and 2006 then we will create two tabs one for 2005 and another for 2006. If the user clicks on the 2005 tab, then 2005 will be passed into the query or if the user clicks on the 2006 tab then 2006 will be passed into the query. I will show how to create tabs in the upcoming steps. You can refer to the below image to hide both report parameters.
Report Parameter General Changes

Set default values

We have to set a default value for both of the report parameters. For the first time when the report will be previewed these default values will be passed into the query and results will be displayed for the default parameter values. We are assigning 2005 as the default value for the Year parameter and 1 as the default value for the Quarter parameter. You can refer to the below image.
Report Parameter Default Tab Changes

Step 4: Add Tablix

Let's add a Tablix for data viewing purposes. I will pull all three data fields from the Main Dataset into the Tablix. After adding the Tablix, the sample report looks like the below image.
Adding Tablix

Step 5: Implementation for a Tabbed Report in SSRS

Step 5.1: We have to add a few text boxes which will be treated as tabs in the report. The text box can either display the parameter value or any meaningful value. As you can see from the below image, first I added a report header and then I added four text boxes in the first row. These four text boxes will be treated as four tabs for four different years and each text box displays the Year parameter value. I also added four more text boxes in the second row, these four text boxes will be treated as four tabs for four different Quarters and each text box displays the Quarter parameter value as shown below.
Adding Textboxs For Tabs
Step 5.2: Right click on the first text box which displays 2005 and click on Text Box Properties, you can refer to the below image. It will open a Text Box Properties Window.
Year 2005 Tab Textbox Properties Window
You have to navigate to the Action tab, here we will implement On Click logic. Our On Click logic is when a user clicks on a tab then an On Click event will call the same report and if the report has parameters it will add the parameters and assign the parameter values in the Action tab. As you can see from the below image, I am calling the same report and this report has two parameters Year and Quarter, so I am adding the parameters too.
Year 2005 Tab Textbox Properties Action Tab Properties
Step 5.2.1: Repeat step 5.2 for the other three remaining tabs. Make sure you change the Year parameter values, i.e. the Text Box which displays 2006 will have a Year parameter value of 2006, the Text Box which displays 2007 will have Year parameter value to 2007, etc.
Step 5.3: For the On Click event we want to highlight the tab selection i.e. if the user clicks on 2006 then it should be highlighted. When the tab is clicked, we will change the background color. Select the first text box and press the F4key, it will open a properties window. In the BackgroundColor value section please use the below expression.
=IIF(Parameters!Year.Value=2005,"LightSteelBlue","No Color")
You can refer to below image.
Year 2005 Tab Background Color On Click
Step 5.3.1: Repeat step 5.3 for the other three remaining tabs. Make sure you change the Year parameter value in the expression.
Step 5.4 We have already configured the Year tabs in previous steps, now we will configure the Quarter tabs. Right click on the first Text Box from the second row (Text Box which displays Q1) and click on Text Box Properties; you can refer to the below image. It will open a Text Box Properties window.
Quarter Q1 Tab Textbox Properties
You have to navigate to the Action tab and make the changes as shown in the below image. Here I am calling the same report and this report has two parameters Year and Quarter. For the Quarter parameter I assign a value of 1 (for quarter 1) and the Year parameter value can be picked from the default/current @Year parameter value as shown below.
Quarter Q1 Tab Textbox Properties Action Tab
Step 5.4.1: Repeat step 5.4 for other three remaining tabs. Make sure you change the Quarter parameter value for each quarter (1-4).
Step 5.5: For the On Click event we have to highlight the current tab selection, like we did for year. We will change the background color when the tab is clicked. Select the first text box and press the F4 key, it will open a properties window. In the BackgroundColor value section please use the below expression.
=IIF(Parameters!Quarter.Value=1,"LightSteelBlue","No Color")
You can refer to below image.
Quarter Q1 Tab On Click Background Color
Step 5.5.1: Repeat step 5.5 for the other three remaining tabs. Make sure you change the Quarter parameter value in the expression for each quarter (1-4).

Step 6: Repeat Tablix Header for Tabbed Report in SSRS

If the report will have more than one page, then the Tablix header will be missing from the second page. We have to show the Tablix header on each page of the report. To do this, please click on the arrow as shown below and chooseAdvance Mode. Once you click on Advance Mode it will show all the static rows under Row Groups and Column Groups.
Tablix Column Groups Advance Mode
In the Row groups, select the first static row and then press the F4 key, it will open the properties window. Please make the below highlighted changes in the properties KeepWithGroup = After and RepeatOnNewPage = True.
Tablix Header Stati RowGroup Properties

Step 7: Preview Tabbed Report in SSRS

We have done all necessary changes, now let's preview the report. As you can see in the left image, 2005 and Q1 Tabs are highlighted. This is because we assigned 2005 and 1 as the default values for Year and Quarter parameters respectively. The report is not showing any data for 2005 and Q1, because there is no data for this combination.
In the report on the right, we can see data when 2005 and Q3 are selected.
Report Preview

Lookup - How to use multiple datasets in a tablix

1.     Background


The purpose of this article is to provide a way of using multiple datasets in a tablix within SQL Server Reporting services 2008 R2. In all the previous versions of SQL Servers (SQL Server 2005/2008), we can use only single dataset for a table/matrix/chart.

2.     How we can use multiple datasets in a tablix?         

SQL Server Reporting Services 2008 R2 has introduced a new function called “LOOKUP”. LOOKUP function is used to retrieve the value from multiple datasets based on 1 to 1 mapping. For example if we have two datasets and both the datasets have EmpID so based on the EmpID mapping, we can retrieve the data from both the datasets.

Syntax: LOOKUP (Key value from already mapped dataset, Key value from new dataset, new value from new dataset)

3.     Create data source and datasets for the report

                    I.            Create a reporting solution in SQL Server Business Intelligence Development Studio.

                  II.            DataSource Creation:
·         For creating a data source for Report, go to Shared data sourceèright clickè Add New data source


·         Click on Editè Provide the server name and database and click ok.


·         Now we can see the connection string for our source server. Click ok.


               III.            Dataset Creation:
·         For creating a dataset, go to Shared datasetsèAdd new dataset


·         Choose the DataSource for the dataset and provide the query:


·         Click ok. Below we can see MyDataset1 has been created:

Follow the same steps for creating MyDataset2.

Query for MyDataset1:
SELECT ProgrammerName,SALARY FROM dbo.Programmer
It returns the programmer name and their salary

Query for MyDataset2:
SELECT ProgrammerName, Skill FROM dbo.Programmer
It returns the programmer name and their skills.

Here we can see the two datasets in the solution explorer:


4.     Create a tablix report with two datasets

                    I.            Create a tablix report : For creating a tablix report, Right click on Reports folderèAddèNew ItemsèReportèGive the name of the report e.g. ProgrammerDetailReport.


                  II.            Insert a tablix in the report: Right click on design surfaceèInsertèTable


                III.            Set the dataset for the tablix:


Let’s select MyDataset1 and click ok.

                IV.            Now we can map the columns from MyDataset1 to the tablix:
                  V.            Below is the report after formatting:


                VI.            Now if you see the property of the report for dataset. It will show two options either MyDataset1 or none. Even there is no option for writing the expression. Moreover, in all the previous version of the SQL Server Reporting services, there is no option for mapping multiple datasets to a tablix.


5.     Step by step procedure to implement multiple datasets in a single tablix


                    I.            Add one more column to the report by right click on the last columnèInsert columnèRight


                  II.            Now we can see another column in the report:


                III.            Now right click on the text box of new columnèchoose Expression:


                IV.            Use the LOOKUP function in the expression editor to map both the datasets and click Ok.

Expression:=Lookup(Fields!ProgrammerName.Value,Fields!ProgrammerName.Value,Fields!Skill.Value,"MyDataSet2")


                  V.            We can give the column header text as Skill. Now report will looks like below one:


6.     Conclusion


By using the LOOKUP function introduced in SSRS 2008 R2, we can map multiple datasets to a tablix.


----------------------------------------------------End of article---------------------------------------------------