Thursday, October 1, 2015

SSRS Architecture

Microsoft SQL Server 2005 or 2K5 was released in the month of November, 2010. In SSRS 2005, virtual directories were created for Report Server and Report Manager. With the feedback from SSRS 2K5 users, Microsoft launched SSRS 2008 version with a lot of enhancements in its architecture, in the month of April, 2010. Out of all the enhancements made in its architecture, the major enhancement is making SSRS independent of IIS (Internet Information Services) which makes it easier to configure. Now, it uses HTTP Listener (HTTP.SYS) which helps to reduce the attack surface of the Report server. It doesn’t require any special setup to install as SSRS comes as an install option with Microsoft SQL Server Developer, Standard and Enterprise editions.
SSRS Architecture :- The full Reporting Services architecture includes development tools, administration tools, and report viewers. It can be summarized as a 3 Tier Architecture as shown below:- SSRS 3 Tier Architecture
Tier 1:- Presentation Tier
Client applications and Built in/Custom tools constitutes the Presentation tier. The Presentation tier works on the data provided by middle tier and handles report generation and report visualization. It includes various components such as Report builder, Report designer, Model designer, Reporting services configuration and other Third party tools. Report generated can be visualized and administered by a Web browser.
Tier 2:- Middle Tier
This acts as a brain for Reporting services and known as Report server. Report server consists of various windows service components and web service components which interacts with Data tier components (Report server database and data sources). This constitutes the Middle tier.
1. Windows service components:-
  • Programmatic Interfaces is responsible to handle on-demand reports, interactive report processing.
2. Web service components:-
  • Scheduling and Delivery processor helps to deliver reports to the target destinations which are being triggered from a schedule.
  • Delivery Extension is used to deliver reports to the specified locations either by an e-mail delivery extension or by a file share delivery extension. E-mail delivery extension uses SMTP (Simple Mail Transfer Protocol) to send an e-mail message to the users whereas file share delivery extension saves the reports to a shared location on the network. Delivery extension works in conjunction with Report Subscriptions.
3. Components common to Window and Web service:-
Extension NameTask Performed
Security Extension
  1. Authenticate and Authorize Users and Groups to a Report server.
  2. By default it is Windows authentication.
  3. Can be customized as per requirement but only one security extension can be used.
Report Processing Extension
  1. Provides custom processing to the special feature added to the report.
  2. By default, Report server can process tables, charts, matrices, lists, text boxes, images, line, rectangle, sub report.
Rendering Extension
  1. Reports containing data and layout information can be rendered from Report
    processor to various device specific formats like
    HTML/Excel/CSV/Image/PDF/XML/Microsoft word.
Data Processing Extension
  1. Interacts with data sources to get flattened row set by performing query on a data source.
  2. Included extensions are there for SQL Server, Analysis server, Oracle, SAP Net Weaver BI, Teradata, Hyperion Essbase, OLE DB, ODBC, ADO.NET.
Tier 3 – Data Tier
  1. Report Server Database.
  2. Data Sources like XML, Oracle, etc.
SSRS Diagram
NOTE: – A Report server requires at least one Security extension, Data processing extension, and Rendering extension. Delivery and custom Report processing extensions are optional, but necessary if you want to support report distribution or custom controls.
  1. Report Server is the core engine and interacts with Report server Database. It provides services for implementation and delivery of reports.
  2. Report Manager is administered via Web browser and manages the Report Server. It provides front end access to the report server web service components
  3. Report Designer is a developer tool for creating reports.
  4. Report Builder is a simplified tool for business users to build reports on fly. It acts as a base for report creation with Report model.
  5. Report Server database stores report definitions.
NOTE: – RDL stands for Report Definition Language. It is an XML file and stores Query information, Data source information, etc.
With this we complete our post on SSRS Architecture. I hope you like it. Your comments and feedbacks are welcome below.


Reporting Services is one of the core component of MS SQL Server. Reporting Services is a server based reporting platform that provides reporting functionality to the user.Report Server is central component of Reporting Services. In this article we will try to understand how SSRS works in native mode deployment.


Reporting Services Report Server runs in one of two deployment modes:
1.       Native Mode
2.       Sharepoint Mode
You can’t switch Report Server mode from one to another  so user has to decide in which mode Reporting Services should be configured at the time of Reporting Services installation. Native mode is the default mode for Report server.

In Native mode Report Server is a stand alone application server that provides all viewing, processing and delivering of the reports and report model. Report Server is implemented as a Microsoft Windows Service called as Report Server.

Native mode reporting services Report Server 3 tier architecture is given below.

Report Server consists of a pair of Processing Engines and five special purposes of extensions which handle Authentication, Report Processing, Rendering, Data Processing and Delivery operation.

Let’s discuss each component from the above architecture.

Tier 3 (Client Application in Presentation layer)

User sends request to report server for Report Processing, Report Scheduling and Delivery etc from any of the client application present in presentation layer i.e Report Manager, Report Builder, Report Designer.

Tier 2 (Report Server Components)

1- Programmatic Interface:

Programmatic interface process all the requests sent to Report Server from the client application present in presentation layer. This includes requests from Report manager, Scheduling and Delivery Processor, Report Design Tools and Third party Tools. Programmatic Interface uses Internet Information Services (IIS) to receive the requests.

When a request arrives at the report server in the form of SOAP (Simple Object Access Protocol) and http request; Programmatic Interface interacts with the Report Server database in response to the request. When a report is requested the programmatic Interface initialize the Report Processor and when a Report Scheduling and Delivery is requested the programmatic Interface initialize the Scheduling and Delivery Processor.

2- Report Processor:

When a report is send from the presentation layer, it will reach to the programmatic layer. Programmatic layer will initialize the Report Processor. Report processor will retrieve the report definition or model information then combines layout information with the data from data processing extension and renders it in the requested format.

Authentication, Report Processing, Rendering , Data Processing and Delivery Extensions

The report server supports five types of extensions, authentication extensions, report processing extensions, rendering extensions, data processing extensions and delivery extensions. A report server requires at least one authentication extension, rendering extension and data processing extension. Delivery and custom report processing extensions are optional.

3- The Scheduling and Delivery Processor

The Scheduling and Delivery Processor processes reports triggered from a schedule, and delivers reports to target destinations.

Tier 1 (Data Layer)

1- Report Server Database:

Reporting Server Database is a SQL Server database. This is created at the time of Reporting Services configuration. It stores Reporting Services data such as Report Definitions, Report Metadata, Cached Reports and snapshots. It also stored security settings, encrypted data, scheduling -delivering and extension information and folder hierarchy. This data is accessed through Report Server. Report Server Database can provide internal storage information for a single reporting services or multiple report server.

2- Data Sources:

This is the data which user wants to represent in reports.

What is MS SQL Server Reporting Services (SSRS) 2008

SSRS stands for Microsoft SQL Server Reporting Services.
History of SQL Server reporting Services : –
For ages Microsoft was not into Reporting services competition. Microsoft SQL server didn’t have any such tool to create enriched user-friendly reports which can help the end-users to vividly visualize data stored in warehouse. Then in the year 2004, Microsoft came up with an idea of having a reporting service in the form of an add-on with SQL Server 2000. Eventually when Microsoft found the growing popularity of this add-on, it decided to put in some efforts to enhance this add-on to make it a core feature of SQL Server .And then came the existence of SQL Server 2005 with the release of reporting service along with integration and analysis services in late 2005.In the year 2010, SQL Server 2008 got released in which more features were added such as Gauge, Charts, etc.The latest version i.e. MS SQL Server 2012 is recently released in the year of 2012.
Introduction Of SSRS : –
  1. Microsoft SSRS is a server based reporting tool which is used as a platform to Create, Deploy, and manage reports.
  2. SQL Server 2008 Reporting services or higher versions are no longer depended on IIS (Internet Information Services) to make it easier to configure. Now, it uses HTTP.SYS which helps to reduce the attack surface of the Report server.
  3. It can be designed using Microsoft Visual Studio (with Business Intelligence product) and is defined in Report Definition Language (an Extensible Markup Language).
  4. With SSRS, we can create attractive and interactive reports that summarize information in ways that makes sense to business users.
  5. SSRS comes as an install option with Microsoft SQL Server Developer, Standard and Enterprise editions.
  6. The main Repository Database of Reporting service is Report Server.
Main Competitor Of SSRS : – SAP Crystal Reports and other Business Intelligence Reporting tools like Tableau, Cognos TM1, etc.
Features Of SSRS : – SSRS is a full featured Report engine and have many features such as:-
  1. There are 2 modes in SSRS – Design mode and Preview mode. Preview mode is one of the powerful features which act as a prototype to the report author that displays the layout in which the report will be published.
  2. With the use of programming languages like C# and VB, we can enhance the reporting functionality of this tool.
  3. Reports can be created in various formats like Tabular, Free- form, Graphical, Interactive and the data in these reports can be visualized with the given tools such as Maps, Graphs, Charts, Sparkline, etc.
  4. Query can be entered by 3 numbers of ways – Text, Table, Stored procedure.
  5. SSRS provides ease for writing Multidimensional Expressions (MDX) and Data Mining Expressions(DMX) Queries by providing drag-n-drop interface.
  6. While writing expressions the IntelliSense feature indicates errors in syntax of expression by underlining them with red lines. It also gives hints for the syntax format while using functions in expressions and names of class members etc.
  7. SSRS allows creating ad hoc reports and saving them to the server. It also provides subscription-based reports and on-demand reports.
  8. Reports can be viewed via a web browser and can be exported into many formats such as EXCEL, MS word-DOC, PDF, CSV, XML, TIFF and HTML web archive.
 SSRS Tool Box contains :-
  1. Text Box.
  2. Table.
  3. Matrix.
  4. Rectangle.
  5. List.
  6. Image.
  7. Subreport.
  8. Chart.
  9. Gauge
This completes the Introduction and Features of MS Sql Server Reporting services. In next article, we will talk about the Architecture Of SSRS.

Thursday, September 10, 2015

Error attaching MdxStepByStep.mdf for SQL Server 2008 R2

In This article I will show how to attach MDXStepByStep database. I have seen many people face problem when attaching the MDXStepByStep database using the attach_db.sql script.


When you execute attach_db.sql script it gives the below error.

Msg 5120, Level 16, State 101, Line 1
Unable to open the physical file "C:\Microsoft Press\MDX SBS\Setup\SQL Server\MdxStepByStep.mdf". Operating system error 5: "5(Access is denied.)".

Please follow the below steps to attach the MDXStepByStep database:

Step 1: Copy only MDXStepByStep.mdf file from “C:\Microsoft Press\MDX SBS\Setup\SQL Server” to “C:\Program Files\Microsoft SQL Server\MSSQL10.MSSQLSERVER\MSSQL\DATA”.

Step 2: Login to your SQL Server with your appropriate credentials, make sure your account must have permission to create database.

Step 3: Right Click on the Database and click on Attach, as shown below.


Step 4: Once you click on attach button it will open a new window. You have to click on add button and then select the MDXStepByStep.mdf file and click ok. You can find below the screenshot.


Step 5: You have added the MDXStepByStep.mdf file but MDXStepByStep.ldf file will be missing for this database because you didn’t copy that file in setp 1. In this step you have to remove the missing file.
Select MDXStepByStep.ldf file and click on remove button and click Ok as shown below.


Congratulations you have successfully attached the MDXStepByStep Database.

Queries for Checking OLAP instances

select * from $SYSTEM.DISCOVER_SESSIONS where session_current_database = 'orgCube'

select * from $system.discover_connections

select * from $system.discover_commands
select * from $system.discover_object_memory_usage
select * from $system.discover_object_activity
select * from $system.discover_locks

Sunday, September 6, 2015

Star schema and Snowflake schema in SSAS 2014


Below table will show the difference between the Star Schema and Snowflake Schema.


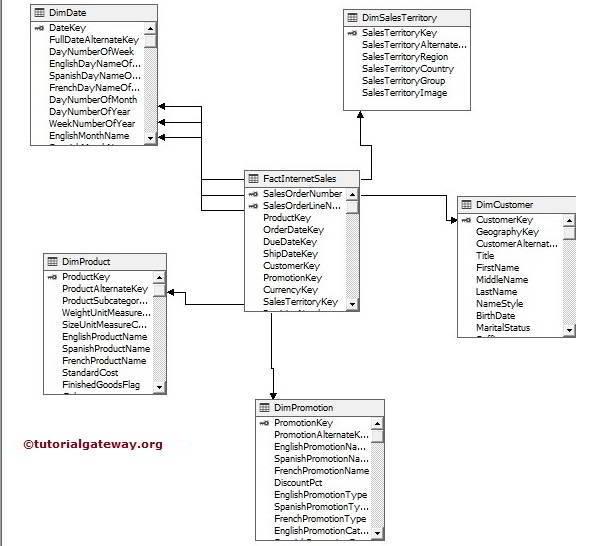
Star Schema: Each and every dimension present in the Data Source View (DSV) is directly linked or related to Fact or measures table.
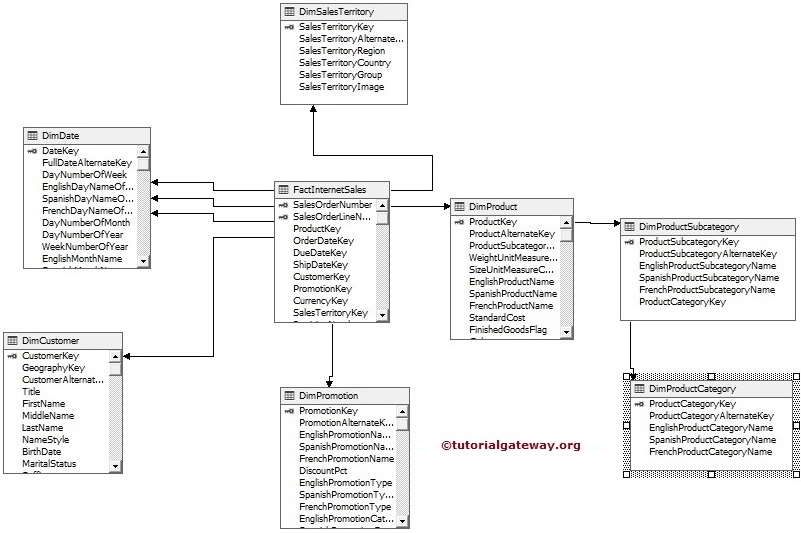
Snowflake Schema: Some dimensions present in the Data Source View (DSV) are linked directly to the fact table and some dimensions are indirectly linked to fact tables (with the help of middle dimensions). For instance in [Adventure Works DW 2014], [Dim Product sub category] is indirectly related to [fact Internet Sales] with the help of [Dim Products]. 
STAR SchemaSnowflake Schema
Centrally located fact table surrounded by DE normalized dimension tableCentrally located fact table surrounded by the normalized dimension table
In Star Schema, All dimensions will be linked directly with fact tableIn Snowflake Schema, some dimensions are linked directly to the fact table and some dimensions are indirectly linked to fact tables (with the help of middle dimensions)
It is easy to understand the designIt is difficult to understand
Increase the query performance because we can extract the data with less number of joinsWe have to join more tables to extract data so more joins
We mostly see the STAR Schemas in small data base or we say small companiesMost of the Big Companies or any big database will always belongs to Snowflake Schema.
By DE normalizing the database we can convert the Snowflake Schema to star schemaBy normalizing the database means dividing the table’s data further using primary and foreign keys we can convert the star schema to Snowflake Schema easily.
STAR FLAKE: A hybrid structure that contains a mixture of star schema (DE normalized data) and snowflake schema (normalized data).

STAR SCHEMA in SSAS EXAMPLE

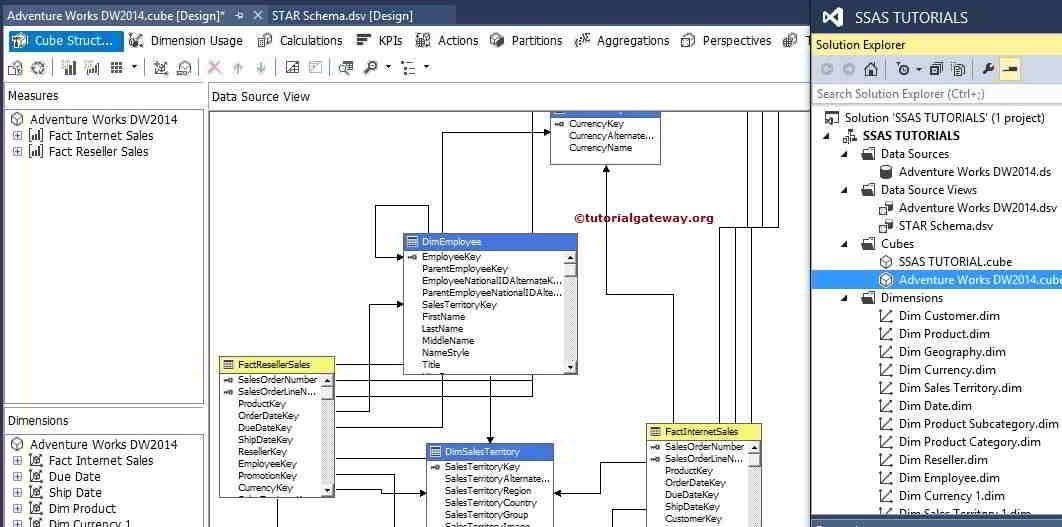
We can see from the below figure [Dim Production], [Dim Customer], [Dim Product], [Dim Date], [Dim Sales Territory] tables are directly attached to [Fact Internet Sales]. So, this is the perfect example for the star schema in SSAS
SSAS Star Schema

SNOW FLAKE SCHEMA in SSAS EXAMPLE

We can see from the below figure [Dim Currency], [Dim Customer], [Dim Date], [Dim Product] tables are directly attached to [Fact Internet Sales] but [Dim Product Sub Category] and [Dim Product Category] are indirectly connected.
SSAS SnowFlake Schema
Thank you for Visiting Our Blog

Create OLAP Cube in SSAS


In this article we are going to show you, How to create OLAP cube in SQL Server Analysis Services (SSAS) using cube Wizard.
Cube is a combination of Measures (Derived, Calculated Measures) and Dimensions, calculations, perspectives, actions, partitions, key performance indicators (KPIs) and translations.

Create OLAP Cube in SQL Server Analysis Services

Within the Solutions Explorer, Right click on the Cube folder will open the context menu. Select New Cube option as shown in below screenshot.
Create OLAP Cube in SSAS 1
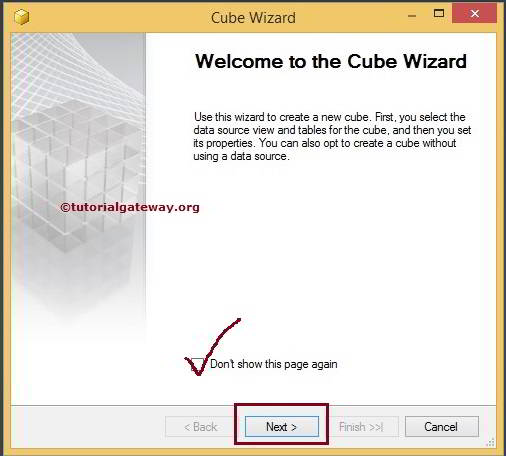
It will open the Cube wizard with the welcome page. If you don’t want to see this welcome page again check the Don’t show this Page again option below.
Create OLAP Cube in SSAS 2
Click next button
Select Creation Method
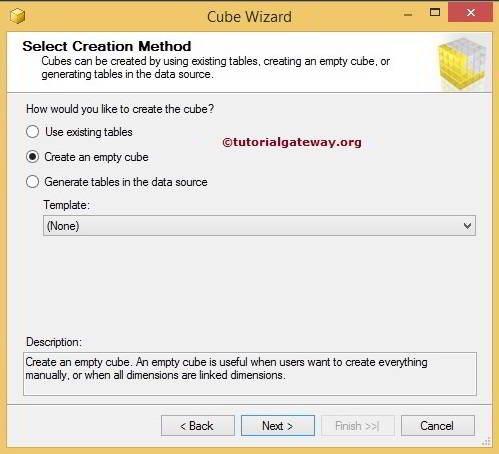
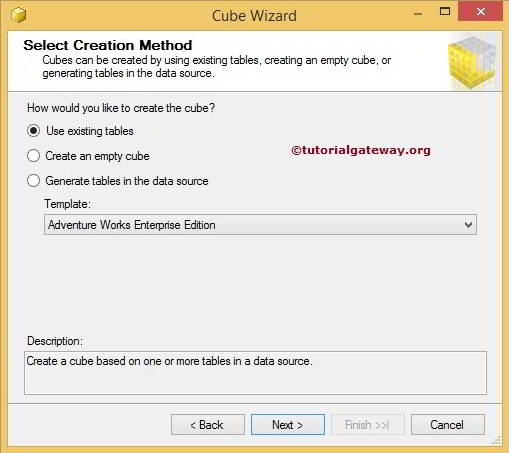
Within the cube wizard this page will give you 3 options to choose
  • Use Existing Tables: If you select this option, then cube will use the existing tables in the Data Source View.
  • Create an Empty Cube: This option will create an empty cube with no Measures and Empty Dimensions. After completing the cube creation we have to add them one by one.
  • Generate Tables in the Data Source: It will generate tables in the Data Source directly.
Create OLAP Cube in SSAS 3
It is always better to choose the option (Create an Empty Cube), that’s what I did in my experience and I hope this is the best approach for any developer. Click on Next Button
Select the Data Source View
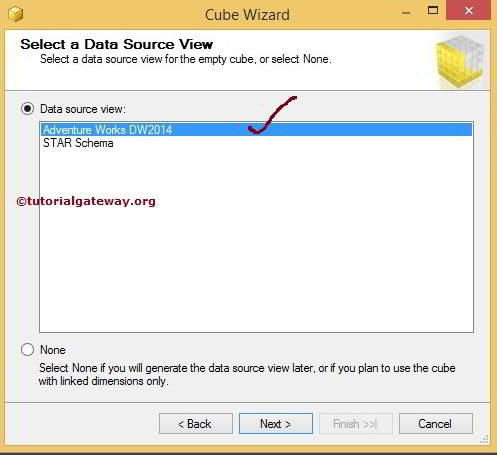
This page is used to select the Data Source View for our Empty cube. Here we can select the data source if we already created or else we can select none and later we can create and use it. Again its developer’s choice but it is always good practice to create the data source and data source views at the beginning.
Create OLAP Cube in SSAS 4
Here we are selecting the Data Source View we created in the previous article. Please referSSAS Data Source View article to understand How to create the Data Source View in SSIS
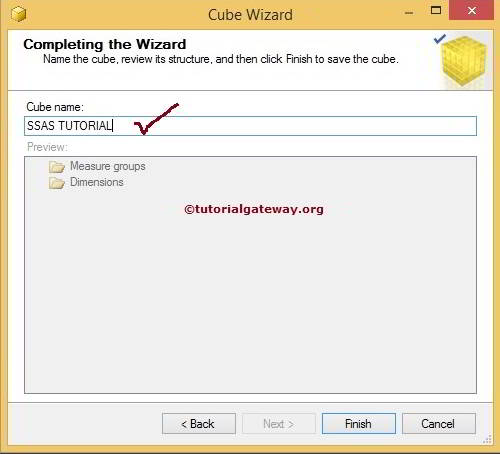
Click Next button and rename the cube as per your requirement.
Create OLAP Cube in SSAS 5
Click finish button to complete the cube creation.
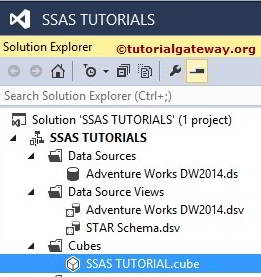
Lets look at our Solution Explorer to check for newly created Cube.
Create OLAP Cube in SSAS 6

Creating Cube Using Existing Tables

Here we are selecting the Existing Tables option to show you, How this gone work.
Create OLAP Cube in SSAS 7
Click on the Next button
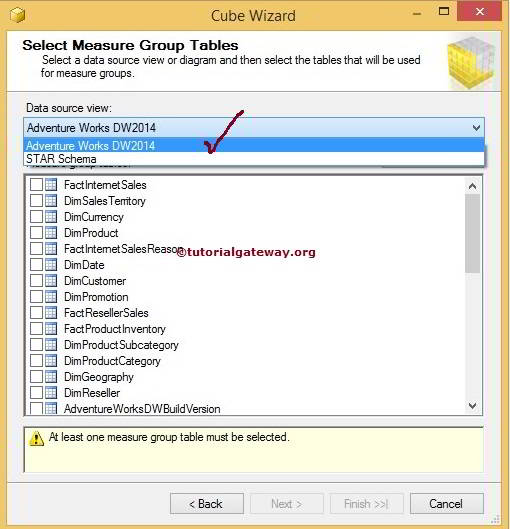
Select Measure Group Tables
Select the already created (existing) Data Source View. Here also we are selecting the Adventure Works DW2014, which we created in our previous article.
Create OLAP Cube in SSAS 8
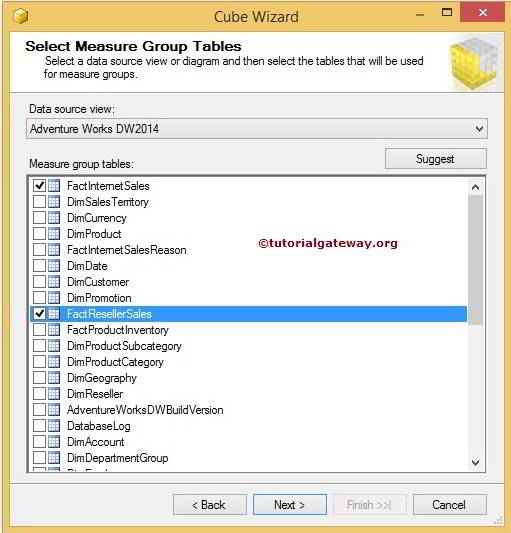
Now select the Measure Tables (Measure Groups or Fact tables) from the list of available tables in the data Source View.
Create OLAP Cube in SSAS 9
Click next button.
Cube wizard will take you to next page to select the individual Measures from Measure Groups.
Create OLAP Cube in SSAS 10
Here we selected some random Measures and click on Next button.
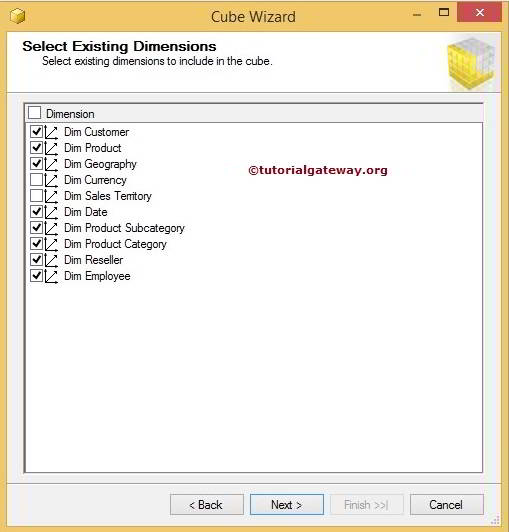
Select Existing Dimension
This page allows us to select the required dimensions for cube creation from the list of available dimensions
Create OLAP Cube in SSAS 11
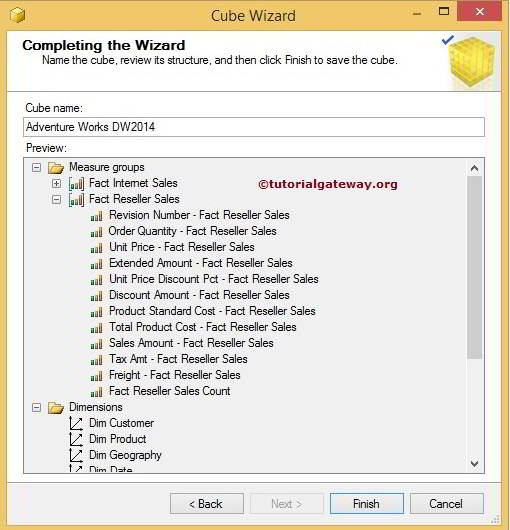
Click on next button and provide the cube name as per your organization requirements.
Create OLAP Cube in SSAS 12
Click finish button and see whether we created the cube successfully or not
Create OLAP Cube in SSAS 13
Thank you for visiting my Blog